The Complaints FloorOfcom Complaints by Provider, Q1 2026 (Report No. 30)
UK telecoms complaints have hit an all time low. Broadband is down to 6 per 100,000 customers, the lowest figure Ofcom has ever published. This is the complete, evidence graded picture of what that number still tells you, what it has quietly stopped telling you, and one accountable forecast, built on 22 cited sources.

The call, weighted
Probability published 28 July 2026 · resolution criteria in Part Three · scored in public on the Q2 and Q3 2026 releases, either way.
Which broadband provider has the most complaints, and is the record low real?
TalkTalk was the most complained about UK broadband provider in Ofcom's Q1 2026 data, at 10 complaints per 100,000 customers. Plusnet had the fewest, at 4. The industry average fell to 6, the lowest Ofcom has ever published. The record is real. But apply Ofcom's own comparability rules and the table barely separates the field any more: an unbroken chain links every broadband provider from best to second worst, and TalkTalk is the only provider Ofcom does not declare comparable to anybody.
Opening
Part One · The Numbers
Part Two · The Interpretation
- What people actually complain about
- The complaint process, end to end
- The blind spot: who is not in this table
- A record low, and a record fine, in the same month
- What the industry said
- Five things that could change this picture
- International comparison: three regulators, three questions
- Measuring what matters
- The Trustpilot test
Part Three · The Forecast
Part Four · The Briefings
Closing
Why a record low is also a warning
Every quarter Ofcom publishes a number that almost nobody reads properly. It counts the complaints the regulator itself received about the UK's largest broadband, landline, mobile and pay TV providers, then scales those complaints per 100,000 customers so that a giant and a challenger can be set side by side. It is the closest thing this industry has to an independent, like for like scoreboard of what service actually feels like when something goes wrong.
This quarter that scoreboard printed a record. Fixed broadband complaints fell to 6 per 100,000 customers, the lowest figure in the fifteen and a half years Ofcom has published this series. Landline, pay monthly mobile and pay TV all sit at, or level with, their own lowest published levels. On the face of it, that is an industry success story, and it deserves to be reported as one.
But a record low is also a measurement problem, and that is the argument of this report. When the whole market compresses into a band of a few whole numbers, and the regulator's own comparability rules then declare most of those numbers statistically indistinguishable from one another, the league table stops being a ranking and starts being a list. In three of the four services Ofcom covers, the table now resolves to a single outlier and a crowd. That matters for anyone who uses this data to choose a provider, to benchmark a competitor, to price risk, or to regulate.
We have written this for the whole market, and not only for broadband. The same measurement problem applies to any regulated service that counts complaints instead of listening for dissatisfaction. Whether you sit in Ofcom, a government department, an infrastructure fund, an altnet build team or a consumer charity, the question we have tried to answer on every page is the same one: so what?
Dr Alex J. Martin-Smith
Founder and Chief Executive, Upleashed Limited · Strategic Lead, SearchSwitchSave Group
Nine things this quarter's data actually says
Six per hundred thousand is a genuine achievement, and this industry has earned the right to say so out loud. But a number this small is also a number that has quietly stopped doing its job. When the whole market fits inside a band of six points, and the regulator's own rules say most of those providers cannot be told apart, the league table is no longer a ranking. It is a list.
Celebrate the number. Do not mistake it for the whole picture.
The three audiences
Only have five minutes? Read the nine findings above, the broadband league, and the compression problem. That is the story.
- Choosing or fighting a provider? The league tables show who to avoid, the complaint process shows how to escalate, and the compensation rates show what you are owed without asking.
- Working in the industry, in government or in policy? Start at the compression problem, then the blind spot, then your briefing in Part Four.
- Pricing risk? The tension section and the investor briefing are yours: a clean complaints line is not a clean compliance position.
The Numbers
What Ofcom published on 23 July 2026, how the figure is built, and what fifteen years of data looks like when you plot it all at once.
How the number is made
Follow one phone call. Yours. Five things happen to it between you picking up the phone and a figure appearing in the news, and every one of them throws something away. That is not a criticism of Ofcom, it is how any national statistic works. But it is why the number is smaller than the problem.
- You ring Ofcom. You have already got nowhere with your provider. You call, write or fill in the web form. Ofcom's Consumer Contact Team logs the service affected and the provider responsible.
- Your call becomes a number. Your one call is logged as up to two complaints, one for each problem you raise. Raise five problems and Ofcom generally records the two most serious. Ofcom says people raising more than two are 1% or less of complainants. An average of 1.5 complaints were recorded per consumer contact in 2021.
- It is filed by service. A broadband fault goes in the broadband pile only. Complain you were mis sold a triple play bundle and it lands in three columns at once. The same frustration can count once or three times.
- It is divided by everyone else. Your complaint is divided by every residential customer your provider has, then multiplied up. That is what per 100,000 means.
- It is rounded, then published. The result is rounded to a whole number. If your provider is small, it never appears at all. That is the figure in the news.
Source: Ofcom, Telecoms and pay-TV complaints: background and methodology, Q1 2026.
The long view: fifteen years of decline, in one picture
Ofcom publishes this series inside an interactive dashboard, one service at a time. Plotted together across the full run, the direction is unambiguous, and so is the point at which the lines run out of room.
See the underlying summary table
| Service | Series start | Peak | Q1 2025 | Q4 2025 | Q1 2026 |
|---|---|---|---|---|---|
| Fixed broadband | 35 (Q4 2010) | 40 (2011) | 10 | 7 | 6 |
| Landline | 42 (Q4 2010) | 42 (Q4 2010) | 5 | 3 | 3 |
| Pay monthly mobile | from Q1 2013 | 2 | 3 | 2 | |
| Pay TV | from Q4 2011 | 4 | 3 | 3 |
Pay TV data begins Q4 2011 and pay monthly mobile Q1 2013. Ofcom advises that pay TV industry averages before Q2 2018, and pay monthly mobile industry averages before Q4 2019, are not comparable with later quarters following methodology changes. Source: Ofcom (2026).
Fixed broadband: TalkTalk alone at the top
TalkTalk recorded 10 complaints per 100,000, unchanged for a third consecutive quarter and the only figure Ofcom does not declare comparable to any other provider. Plusnet returned the fewest at 4. Every other provider landed between 5 and 8, inside a band narrow enough that Ofcom's own rules treat neighbouring pairs as equivalent. Vodafone posted the largest single improvement, from 11 to 8, its lowest figure in the published series.
See the quarter on quarter table
| Provider | Q1 2025 | Q4 2025 | Q1 2026 | Move |
|---|---|---|---|---|
| Plusnet | 5 | 5 | 4 | Better |
| Sky | 6 | 7 | 5 | Better |
| Virgin Media | 12 | 5 | 6 | Worse |
| EE | 11 | 8 | 6 | Better |
| BT | 11 | 8 | 7 | Better |
| Vodafone | 11 | 11 | 8 | Better |
| TalkTalk | 13 | 10 | 10 | Flat |
| Industry average | 10 | 7 | 6 | Better |
Source: Ofcom (2026). Differences of less than one complaint per 100,000 are within Ofcom's stated comparability tolerance.
One provider is missing. NOW Broadband has no published fixed broadband figure for either Q4 2025 or Q1 2026, its last being 4 in Q3 2025, although it still appears in the landline table. Ofcom's stated rule is that a provider is generally removed once its market share has been below 1.5% for four consecutive quarters. Ofcom has not confirmed the reason in this case, so we report the gap rather than explain it.
Seven trajectories since 2019
A single quarter tells you very little. Set against each provider's own worst quarter since 2019, the differences between these providers are differences of direction, not of level. Every provider in the table sits below its own 2019 starting point, and the convergence is the compression problem made visual: seven separate lines arriving at almost the same place.
See the table
| Provider | Peak since 2019 | Q1 2026 |
|---|---|---|
| Plusnet | 31 | 4 |
| Sky | 7 | 5 |
| Virgin Media | 33 | 6 |
| EE | 14 | 6 |
| BT | 16 | 7 |
| Vodafone | 31 | 8 |
| TalkTalk | 25 | 10 |
| Industry average | 19 | 6 |
Broadband complaints per 100,000. Source: Ofcom (2026).
The exception. TalkTalk is the one line that has not returned to the pack. It has printed 10 for three consecutive quarters while the industry average fell from 8 to 6, so the gap between TalkTalk and the market widened even as its own figure held still.
The compression problem: the table is running out of room to rank
This is the finding we think matters most, and it is the reason this report exists rather than a simple data update.
Two Ofcom conventions now collide. The first is that figures are published as whole numbers. The second is that where the actual measurable difference between two providers is less than one complaint per 100,000, Ofcom states their performance should be considered comparable.
When the whole market sat between 10 and 87 complaints per 100,000, as it did in Q4 2010, those rules caused no difficulty. In Q1 2026 the gap between the best and worst broadband provider is 6 points, equal narrowest on record. Six of the seven providers listed sit inside a four point band.
Apply Ofcom's own published comparability groups for this quarter and the result is stark:
- Fixed broadband: Plusnet with Sky; Sky with Virgin Media, EE and the average; the average with BT; BT with Vodafone. An unbroken chain from best to second worst. One chain, one outlier: TalkTalk.
- Pay monthly mobile: EE, giffgaff, Vodafone, Three, Tesco Mobile and the average; then the average, O2 and iD Mobile. One chain covering seven of eight providers. One outlier: Sky Mobile.
- Pay TV: TalkTalk with Sky; Sky with the average and Virgin Media; Virgin Media with EE. One chain covering all four providers. No outlier at all.
- Landline: three genuinely separate clusters. Landline is the one table that still discriminates.
Each solid link is a pair Ofcom declares statistically comparable in Q1 2026. One unbroken chain runs from best to second worst. TalkTalk sits outside every group. Broadband complaints per 100,000.
Landline: the one table that still separates the field
Plusnet recorded the most landline complaints at 7, up from 5, and TalkTalk was second on 6. Ofcom names both as the most complained about landline providers this quarter. The Plusnet result is the most interesting number in the whole release: in the same quarter, under the same brand, Plusnet produced the fewest broadband complaints in the market and the most landline complaints in the market. ISPreview reports that 41% of Plusnet's landline complaints were driven by faults, service and provisioning.
See the table with Q4 2025
| Provider | Q4 2025 | Q1 2026 |
|---|---|---|
| Sky | 2 | 2 |
| Utility Warehouse | 1 | 2 |
| Virgin Media | 2 | 2 |
| Vodafone | 3 | 2 |
| EE | 6 | 3 |
| BT | 5 | 4 |
| NOW Broadband | 6 | 4 |
| TalkTalk | 5 | 6 |
| Plusnet | 5 | 7 |
| Industry average | 3 | 3 |
Source: Ofcom (2026).
Vodafone recorded 2, its lowest landline figure in the published series. EE improved sharply from 6 to 3. Ofcom names EE, Sky, Utility Warehouse, Virgin Media and Vodafone among the least complained about.
Pay monthly mobile and pay TV
Sky Mobile was the most complained about pay monthly mobile provider on 4, and the only mobile brand outside Ofcom's comparability chain. Ofcom states these complaints were primarily driven by customers' experiences changing provider. O2 fell from 7 to 3 as the Q4 2025 spike unwound; that spike followed mid contract price rise announcements, and its reversal is the single largest reason the overall complaints total fell this quarter. giffgaff enters the table for the first time on 1, joint fewest.
See the mobile table with Q4 2025
See the pay TV table with Q4 2025
| Provider | Q4 2025 | Q1 2026 |
|---|---|---|
| EE | 1 | 1 |
| giffgaff | Not listed | 1 |
| Vodafone | 2 | 1 |
| Three | 1 | 2 |
| Tesco Mobile | 1 | 2 |
| O2 | 7 | 3 |
| iD Mobile | 3 | 3 |
| Sky Mobile | 5 | 4 |
| Industry average | 3 | 2 |
Source: Ofcom (2026). Mobile figures cover pay monthly services only.
| Provider | Q4 2025 | Q1 2026 |
|---|---|---|
| TalkTalk | 2 | 2 |
| Sky | 3 | 2 |
| Virgin Media | 3 | 3 |
| EE | 5 | 4 |
| Industry average | 3 | 3 |
Source: Ofcom (2026).
EE recorded the most pay TV complaints on 4, improving from 5, with Virgin Media on 3. Ofcom states that EE's complaints were mainly about how complaints were handled, while Virgin Media's were mainly about billing, pricing and charges. Sky and TalkTalk, both on 2, generated the fewest. Pay TV is the clearest illustration of the compression problem: Ofcom's comparability groups link all four providers in a single unbroken chain, so no provider here is statistically distinguishable from the field as a whole.
One network, four results
Four of the eight brands in Ofcom's pay monthly mobile table run on a single physical network, and between them they occupy every position in the table from joint best to outright worst. giffgaff, Tesco Mobile and Sky Mobile are all mobile virtual network operators (MVNOs) running on the Virgin Media O2 network, alongside O2's own retail brand.
See the table
| Brand | Type | Q1 2026 |
|---|---|---|
| giffgaff | MVNO | 1 (joint fewest in the whole table) |
| Tesco Mobile | MVNO | 2 |
| O2 | Own retail brand | 3 |
| Sky Mobile | MVNO | 4 (most in the whole table) |
Complaints data: Ofcom (2026). Host network attribution is from published industry reporting and the operators' own descriptions, not from Ofcom. Ofcom publishes these as four separate providers and does not group them by host network.
That is the entire range of the mobile table, from the joint fewest complaints to the most, generated over identical masts, identical spectrum and identical coverage. Whatever separates giffgaff from Sky Mobile, it is not the network.
Nine quarters at a glance
Two years of data, every provider in this quarter's tables. Higher numbers mean more complaints. Read across for a provider's trajectory, and down a column for the shape of the market in that quarter. The dark column mobile suffered in Q4 2025, driven by mid contract price rise announcements, has almost entirely cleared by Q1 2026.
Fixed broadband
| 24Q1 | 24Q2 | 24Q3 | 24Q4 | 25Q1 | 25Q2 | 25Q3 | 25Q4 | 26Q1 | |
|---|---|---|---|---|---|---|---|---|---|
| Plusnet | 8 | 6 | 8 | 5 | 5 | 4 | 4 | 5 | 4 |
| Sky | 6 | 5 | 5 | 5 | 6 | 6 | 6 | 7 | 5 |
| Virgin Media | 18 | 15 | 12 | 11 | 12 | 8 | 7 | 5 | 6 |
| EE | 14 | 14 | 13 | 12 | 11 | 10 | 9 | 8 | 6 |
| BT | 9 | 10 | 10 | 10 | 11 | 9 | 9 | 8 | 7 |
| Vodafone | 16 | 12 | 11 | 11 | 11 | 9 | 10 | 11 | 8 |
| TalkTalk | 11 | 10 | 14 | 13 | 13 | 9 | 10 | 10 | 10 |
| Industry average | 12 | 10 | 10 | 9 | 10 | 8 | 8 | 7 | 6 |
Landline
| 24Q1 | 24Q2 | 24Q3 | 24Q4 | 25Q1 | 25Q2 | 25Q3 | 25Q4 | 26Q1 | |
|---|---|---|---|---|---|---|---|---|---|
| Vodafone | 5 | 3 | 3 | 3 | 3 | 3 | 4 | 3 | 2 |
| Sky | 2 | 2 | 2 | 2 | 2 | 2 | 2 | 2 | 2 |
| Virgin Media | 11 | 8 | 7 | 6 | 5 | 4 | 3 | 2 | 2 |
| Utility Warehouse | 1 | 0 | 1 | 1 | 1 | 0 | 1 | 1 | 2 |
| EE | 11 | 15 | 8 | 8 | 8 | 8 | 6 | 6 | 3 |
| NOW Broadband | 12 | 10 | 8 | 10 | 4 | 4 | 5 | 6 | 4 |
| BT | 5 | 7 | 6 | 7 | 7 | 4 | 5 | 5 | 4 |
| TalkTalk | 8 | 5 | 8 | 7 | 8 | 6 | 6 | 5 | 6 |
| Plusnet | 5 | 5 | 6 | 4 | 3 | 3 | 5 | 5 | 7 |
Pay monthly mobile
| 24Q1 | 24Q2 | 24Q3 | 24Q4 | 25Q1 | 25Q2 | 25Q3 | 25Q4 | 26Q1 | |
|---|---|---|---|---|---|---|---|---|---|
| EE | 2 | 2 | 2 | 2 | 2 | 1 | 1 | 1 | 1 |
| giffgaff | · | · | · | · | · | · | · | · | 1 |
| Vodafone | 2 | 2 | 2 | 2 | 1 | 1 | 1 | 2 | 1 |
| Three | 4 | 3 | 3 | 3 | 2 | 3 | 2 | 1 | 2 |
| Tesco Mobile | 1 | 1 | 1 | 1 | 1 | 1 | 1 | 1 | 2 |
| O2 | 7 | 7 | 5 | 4 | 3 | 2 | 2 | 7 | 3 |
| iD Mobile | 4 | 3 | 2 | 3 | 2 | 2 | 1 | 3 | 3 |
| Sky Mobile | 2 | 2 | 1 | 1 | 2 | 2 | 3 | 5 | 4 |
Pay TV
| 24Q1 | 24Q2 | 24Q3 | 24Q4 | 25Q1 | 25Q2 | 25Q3 | 25Q4 | 26Q1 | |
|---|---|---|---|---|---|---|---|---|---|
| TalkTalk | 3 | 2 | 2 | 2 | 3 | 1 | 2 | 2 | 2 |
| Sky | 2 | 1 | 2 | 2 | 2 | 2 | 3 | 3 | 2 |
| Virgin Media | 11 | 9 | 9 | 7 | 8 | 5 | 5 | 3 | 3 |
| EE | 2 | 9 | 8 | 6 | 7 | 6 | 6 | 5 | 4 |
· = no figure published that quarter. giffgaff first appears in Q1 2026. Source: Ofcom (2026).
The Interpretation
What the numbers mean for each part of the market, what the data cannot see, and the arguments that could yet prove this record low wrong.
What people actually complain about
The headline numbers tell you who. The category breakdown tells you why, and the answer is consistent across the market.

- Faults, service and provisioning leads in three of the four services. It accounted for 40% of TalkTalk's broadband complaints, 41% of Plusnet's landline complaints and 23% of Sky Mobile's mobile complaints.
- Complaints handling is the exception that proves the point. For EE's pay TV service, 27% of complaints were about how the complaint itself was handled, rather than the original problem.
- This is an execution problem, not a product problem. A market running at 6 complaints per 100,000 has largely solved its product questions. What remains is generated in the field and in the contact centre: installs that slip, faults that recur, appointments missed, cases not closed.
Category shares as reported by ISPreview from the Ofcom release. Categories are Ofcom's own. Source: Jackson (2026).
The complaint process, end to end
A persistent misunderstanding sits behind this data: people assume complaining to Ofcom will get their problem fixed. It will not. Here is the route that does. Every step in stage one is something your provider must do by law under General Condition C4.

Stage one: with your provider
- Tell them. Ring, write, or use their online form. They must offer all three, and must tell you their process and their timeframes.
- They investigate. They must keep working on it until it is genuinely sorted or properly closed. Keep your own notes: dates, names, reference numbers.
- They give you an answer. If you are not happy, say so in writing and keep the date. Stay silent for 28 days and they may lawfully close it as settled.
- Deadlock, or six weeks. If they will go no further they must issue a deadlock letter immediately. Otherwise the six week clock lets you escalate anyway.
Stage two: over their head
- Go to the free referee. CISAS or the Communications Ombudsman, depending on your provider. Free to you; your provider pays to take part.
- They decide. If they agree with you they can order a remedy, up to £10,000, though a typical award is £50 to £100 plus putting the problem right.
- You choose. Accept and it binds your provider. Reject it and you keep every legal right you had, including court.
The two clocks that catch people out
These start on different days, and confusing them is the most expensive mistake in the process.
- Six weeks starts the day you first complain. When it runs out you can go to the free referee. A deadlock letter opens that door immediately.
- 28 days starts the day they give you their answer. If you have said nothing by then, they can close it as settled. This is the one people miss.
What you are owed, without asking
Rates set by Ofcom, effective 1 April 2026, paid as a bill credit within 30 days. The scheme is voluntary: Ofcom reports signed up providers cover 97% of landline and 91% of broadband customers, so check yours is in it. These three failures only, not slow speeds.
The blind spot: who is not in this table
Ofcom generally includes only providers with a stable market share of 1.5% or more in the relevant market, and states these providers account for at least 95% of the fixed broadband market, 91% of landline, 98% of pay monthly mobile and 99% of pay TV. That is a defensible design choice, because complaints per 100,000 becomes unstable at small subscriber counts, and Ofcom says so explicitly.
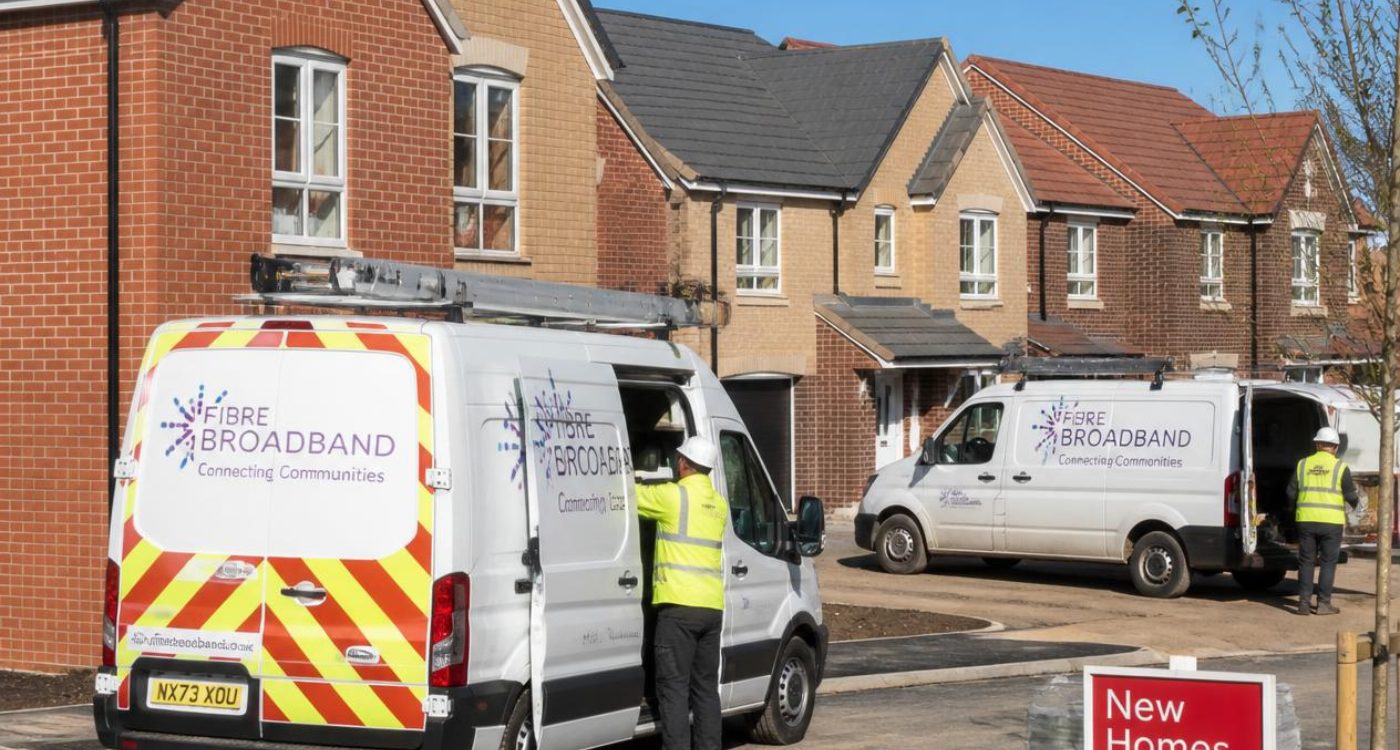
The practical consequence is that no alternative network retail brand appears in the table at all. A household choosing between a national brand and a well run local full fibre provider can compare price and speed on equal terms, but not service quality. As retail share continues to fragment across the full fibre market, the share of UK connections invisible to this measure grows. That is a structural disadvantage for good altnets, who have no route to prove quality alongside the incumbents, and a genuine gap for policymakers assessing whether infrastructure competition is improving service or only price.
NOW Broadband shows the mechanism. It has no published fixed broadband figure for Q4 2025 or Q1 2026, its last being 4 in Q3 2025, among the strongest results in that quarter's table, yet it continues to appear in the landline table. A brand can disappear from the scoreboard while still selling broadband, and its absence looks identical to never having been measured at all.
A record low, and a record fine, in the same month
On 23 July 2026 Ofcom published the lowest complaints figures in the history of the series. Fifteen days earlier, the same regulator issued its largest ever fine for direct harm to consumers.
On 8 July 2026 Ofcom fined Virgin Media £28 million after finding that its cancellation process and agent behaviours caused customers on millions of calls unreasonable effort, hassle or undue difficulty when trying to cancel. The conduct ran from January 2022 to September 2024. The penalty included a 30% reduction because Virgin Media admitted the failings and settled, and Ofcom directed the company to check that every affected customer who complained received the remedies they were entitled to.
Hold the two facts together and the lesson is useful. Through much of the period Ofcom was investigating, Virgin Media's broadband complaints to Ofcom were falling, and by Q4 2025 it was among the least complained about providers in the table. A low complaints figure is evidence about complaints made to Ofcom. It is not evidence of regulatory compliance. Harm that is systemic, procedural and spread thinly across millions of interactions may never produce a complaints spike, because each individual customer experiences friction rather than outright failure. Enforcement also runs on a far longer clock than this data set: Ofcom opened the investigation in July 2023 and concluded it three years later, by which time the complaints table had moved on entirely.
What the industry said
We were not the only people covering this release, and the range of interpretation is wider than the headlines suggest. Each position below is summarised in our own words from published sources.
- Ofcom welcomed the record low but warned against complacency. Cristina Luna-Esteban, Ofcom's Director of Consumers and Retail Markets, said the regulator expects providers to keep improving and encouraged dissatisfied customers to switch, pointing to end of contract alerts, simpler contract summaries and easier switching as the reforms behind the improvement. (Reported by Advanced Television, 23 July 2026)
- ISPA, the trade association for UK broadband providers, attributed the fall to more than £40 billion of investment in gigabit capable infrastructure, gigabit availability above 90% of premises, rising speeds, falling real terms prices and One Touch Switch. (Reported by Advanced Television, 23 July 2026)
- ISPreview reported the record low alongside the important caution that the data covers only complaints Ofcom itself receives, not those made to an ISP or an ADR scheme. It noted Ofcom received 38,441 telecoms complaints directly from consumers in 2024. (Mark Jackson, ISPreview, 23 July 2026)
- thinkbroadband set out competing explanations. The optimistic reading is better full fibre reliability and altnets picking up customers where incumbents underperform. The sceptical reading is that providers have simply become better at handling billing and fault failures, so underlying fault levels may be unchanged while fewer people escalate to the regulator. (thinkbroadband, 23 July 2026)
- TalkTalk said it is transforming its customer service to better identify and resolve the root causes of complaints, that it is disappointed by these results, and that continued investment is starting to benefit customers, which it expects to show in future quarters. (Reported by ISPreview, 23 July 2026)
Several price comparison sites also commented on this release. As a comparison site ourselves we do not cite competitors as sources, so their views are not summarised here.
Five things that could change this picture
A report that only argued its own case would not be worth much. These are the strongest challenges to the conclusions above, including one that could undo the headline entirely.
1. The deflection hypothesis, and the strongest case against us
This is the most serious challenge to the record low. thinkbroadband argues that providers may simply have become better at containing complaints before they escalate, meaning underlying fault levels could be unchanged while fewer people take what it calls the nuclear option of going to the regulator. Nothing in the Ofcom data can settle this either way. A falling complaints line is consistent with genuinely better service and with more effective complaint containment.
2. The missing denominator: ADR volumes
Ofcom's own methodology states its figures exclude complaints made directly to providers and to Alternative Dispute Resolution schemes. CISAS and the Communications Ombudsman separately publish case data. Pairing the two series is the obvious test of the deflection hypothesis: if Ofcom complaints fall while ADR caseloads hold or rise, containment is the likelier explanation. We have not run that comparison here because it needs its own dataset and methodology note, and we will not assert a conclusion we have not evidenced.
3. The Digital Voice blip
The PSTN closes on 31 January 2027. thinkbroadband expects a possible increase in complaints within six months as households that have delayed migrating to Digital Voice or VoIP are finally moved. This is the most predictable risk to the record low, and it lands in the same table where Plusnet and TalkTalk are already the worst performers. Q2 and Q3 2026 landline figures are the ones to watch, and they are the subject of the forecast in Part Three.
4. A policy change mid flight
DSIT is being wound down under the machinery of government changes set out in the government's fact sheet of 22 July 2026, the day before this data was published. Most functions move to the new Department for Business, Innovation, Science and Trade (DBIST), with digital identity policy going to DCMS and AI strategy to the Cabinet Office. Reporting at the time indicated BDUK's work continues uninterrupted, though gov.uk had not yet confirmed its new home. The department that owned national digital infrastructure policy when this quarter's complaints were made is being dissolved, which matters for anyone citing DSIT in current documents.
5. The companion metric Ofcom already publishes
Ofcom's Comparing customer service research covers satisfaction, reliability and complaints handling by provider, using survey evidence rather than complaint counts. As the complaints league loses its power to separate providers, that research becomes the more useful consumer facing comparison. The two should be read together, and arguably published together.
International comparison: three regulators, three different questions
Before any cross border number is quoted, it is worth knowing what each regulator actually collects. The three systems below are not three versions of the same measure. They are three different measures wearing the same word.
| United Kingdom · Ofcom | United States · FCC | Europe · BEREC and national regulators | |
|---|---|---|---|
| What is counted | Complaints made directly to the regulator, normalised per 100,000 subscribers, published quarterly by named provider above a 1.5% market share | Informal complaints logged on a public dashboard and served on the carrier, which must respond within 30 days. Organised by issue category, not by provider rate | Coordinated but fragmented. Every member state publishes on its own definitions. ADR is mandated in all 27 states by the European Electronic Communications Code |
| Key facts | 6 per 100,000 broadband in Q1 2026 · 38,441 telecoms complaints to Ofcom in 2024 · 29.2m UK fixed broadband lines at Q4 2024 · Ofcom does not resolve cases; two ADR schemes do | A live dashboard, continuously updated · organised by issue, not by provider · informal complaints fell from a 2018 peak · the FCC serves and forwards; it does not rule | France, ARCEP: 57,000+ signalements in 2024, up 8% · Germany, BNetzA: 154,624 number misuse cases in 2024 · Italy, AGCOM: compulsory ConciliaWeb conciliation · no EU wide league table equivalent to Ofcom's |
| The verdict | The only genuine named provider league table of the three | No per subscriber ranking of named ISPs exists | Comparable ambition, incomparable outputs |
Can these numbers be compared? Mostly, no
This is the part most coverage skips. We are not going to publish a table ranking the UK against the US and Europe, because the underlying definitions do not support one. Ofcom counts complaints made to the regulator. The FCC counts informal complaints it forwards to carriers. ARCEP counts signalements, which are alerts rather than disputes. AGCOM counts conciliation cases already heading for binding resolution. These are four different points in the same funnel, and only Ofcom and ARCEP normalise per 100,000.
The one comparison that looks possible is a trap. ARCEP's 2024 fixed market signalement rates ran at roughly 75 to 100 per 100,000 users for Orange, SFR and Bouygues, and about 150 for Free. Ofcom's equivalent figure is 6. That is not evidence that French broadband is fifteen times worse. It is evidence that a low friction alerting platform collects far more reports than a regulator complaints line. The gap is definitional.
Measuring what matters: complaints measure failure, not quality
A complaint count can only ever tell you how often something went wrong badly enough that somebody escalated it. It is silent on the experience of the overwhelming majority who never complain, whether they are delighted or quietly resigned. Moving an industry from acceptable to outstanding needs a measure that can see both.
- Complaint counts measure failure. Counts only those who complained, and only to the regulator. Falls when service improves and also falls when people give up complaining. A lagging, negative only signal. (Ofcom, per 100,000.)
- Satisfaction indices measure quality. Survey based, representative, scored 0 to 100. Captures the silent majority who never complain, positive and negative alike. Published far less often than complaints. (ACSI, UKCSI, Ofcom research.)
- Crowd review scores measure sentiment. Continuous and public, captures praise and anger together. But self selected, and heavily shaped by whether a provider invites reviews at all. (Trustpilot and similar.)
The Trustpilot test: we tested the obvious alternative. It failed
The two regulator measures agree with each other. Ofcom publishes two independent things: how many people complained, and how satisfied customers say they are. On complaints, Plusnet is best in the market at 4 per 100,000. On satisfaction, Ofcom names Plusnet as the highest, at 91%. On both, TalkTalk is worst: 10 per 100,000 and 77%. Two different instruments, built on different evidence, pointing the same way.
Trustpilot disagrees with both. On a verified capture of 501,802 reviews across the seven main provider profiles, Plusnet sits sixth of seven at 1.8 out of 5, and TalkTalk fifth at 2.2. Ranking the seven on each measure gives a rank correlation of about minus 0.4. With only seven providers that is not statistically significant, and we do not claim it is. But it is the opposite of the corroboration the two Ofcom measures show.
Left: Ofcom broadband complaints per 100,000, best first (ties share a rank). Right: Trustpilot score rank, best first, from a manual capture of 501,802 reviews on 26 July 2026. Pink: Plusnet and TalkTalk, the two providers Ofcom's measures single out. The lines cross because the two measures rank the field in nearly opposite order.
See the full data table
| Provider | Ofcom complaints per 100,000 (lower better) | Trustpilot score out of 5 (higher better) | Trustpilot reviews |
|---|---|---|---|
| Plusnet | 4 | 1.8 | 12,473 |
| Sky | 5 | 2.7 | 29,087 |
| Virgin Media | 6 | 1.5 | 105,525 |
| EE | 6 | 4.3 | 98,306 |
| BT | 7 | 3.9 | 30,460 |
| Vodafone | 8 | 4.7 | 136,495 |
| TalkTalk | 10 | 2.2 | 89,456 |
Trustpilot scores and review counts captured manually on 26 July 2026 from each provider's main UK consumer profile, because Trustpilot blocks automated collection. Scores update continuously. Total reviews across the seven profiles: 501,802. Ofcom satisfaction: Comparing customer service, published 22 May 2025, covering 2024.
Trustpilot itself explains why. Trustpilot labels the Plusnet profile with a warning that the company has no history of asking for reviews, and that reviews may therefore not be representative. Providers that invite every customer collect a broad, mostly contented sample. Providers that invite nobody collect only the self selected minority motivated enough to arrive unprompted, who skew heavily negative. Vodafone holds 136,495 reviews against a customer base far smaller than BT's or Sky's.
The same brand can score three points apart. At capture, EE's main profile stood at 4.3 while its broadband specific profile sat at 1.2, a gap of 3.1 points for one company on one platform. TalkTalk's main profile and a secondary profile differed by 1.0. A brand's score depends on which of its profiles you happen to land on, which is not a property you want in a ranking.
The Forecast
One call, with resolution criteria set before the outcome is known, scored in public either way.
One call we will be marked on
Reports 26 and 27 published probabilities in advance and committed to scoring them in public. This one does the same: a single claim with resolution criteria set before the outcome is known.
Our call: UK landline complaints will rise above 3 per 100,000 in at least one of Q2 or Q3 2026.
65% our confidence, published before the outcome is known.
Why we think so
The PSTN closes on 31 January 2027 and the remaining analogue lines are the hardest ones. thinkbroadband expects a complaints rise within six months as delayed Digital Voice migrations finally happen. Landline is already the one table with genuine separation, and Plusnet at 7 and TalkTalk at 6 have room to move.
Why we might be wrong
Providers have had years to prepare and the migration has been deliberately slowed to protect vulnerable users. A quarter at 3 is already close to the floor, and the whole argument of this report is that the measure struggles to register small movements.
How to mark our homework
Scored against Ofcom's published landline industry average for Q2 2026 and Q3 2026, on the quarterly releases expected in late 2026 and early 2027. If either quarter prints 4 or higher, the call resolves true. If both print 3 or lower, it resolves false. We will publish the result either way, in the corrections log, whether it flatters us or not.
The missed opportunity
Read this data as it is usually reported and you would think a complaint is a serious event, worth recording only once it is grave enough to involve a regulator. That framing is the problem.
Ofcom's figure counts the small minority who complained, escalated, and got as far as the regulator. At 6 per 100,000 that is roughly one customer in sixteen thousand. Everyone else is invisible to it: the sigh at the third transfer, the customer who gives up halfway through the webchat, the one who quietly switches at the end of the contract and never says why. Every one of those is an expression of dissatisfaction, and not one of them reaches this table.
Nobody ever rang Ofcom because their broadband worked. That is the whole problem with judging an industry on complaints alone. If you are stuck in a complaint right now, the number that matters is not six per hundred thousand. It is six weeks, because that is when you can go over your provider's head and get an independent decision.
Know that date. Diarise it.
The Briefings
So what, for every part of the market. Six briefings, one per stakeholder group, each ending with the action that follows from the data.
For Ofcom, DBIST, BDUK and the devolved administrations
The instrument is approaching the limit of its own resolution. Ofcom publishes to whole numbers and treats gaps of less than 1 as comparable. With a broadband industry average of 6 and a total spread of 6 points, those two rules now interact: six of seven broadband providers sit inside a 4 point band, and the comparability chain runs unbroken from best to second worst. This lands mid reorganisation: DSIT is being wound down, with most functions moving to the new DBIST under changes set out on 22 July 2026.
So what: the complaints series is still an excellent longitudinal measure of whether the market is improving. It is becoming a weak cross sectional measure of which provider is better. If the table is to keep doing consumer facing work, it needs either finer reporting (one decimal place is already used when a figure falls below 0.5) or a companion metric. Ofcom's own Comparing customer service research is the obvious pairing.
For infrastructure providers, altnets, INCA and techUK
The table only includes providers with a stable market share of 1.5% or more in the relevant market. Every altnet, and every retail brand below the threshold, is therefore absent by design. NOW Broadband illustrates the mechanism: it has no published fixed broadband figure for Q4 2025 or Q1 2026, its last being 4 in Q3 2025, although it remains in the landline table.
So what: as retail share fragments, a growing slice of UK connections sits outside the only independent service quality scoreboard consumers are pointed at. That is a competitive disadvantage for good altnets, who cannot prove quality on the same page as the incumbents, and a gap for policymakers tracking whether infrastructure competition is improving service or only price.
For retail service providers and MSPs
Faults, service and provisioning is the single largest driver in three of the four services. It accounted for 40% of TalkTalk's broadband complaints, 41% of Plusnet's landline complaints and 23% of Sky Mobile's mobile complaints. For EE's pay TV service, 27% of complaints were about complaints handling itself.
So what: the remaining complaint volume is an operational execution problem, not a product problem. It is generated in the field and in the contact centre: installs that slip, faults that recur, escalations handled badly. Plusnet's split result, best on broadband and worst on landline in the same quarter, shows how sharply one process can diverge from another inside one brand.
For investors, lenders and rating agencies
Complaint rates are a cheap, public, quarterly proxy for churn pressure and regulatory exposure. But Q1 2026 shows the limits of using them alone. Virgin Media's broadband complaints to Ofcom sat at or below the industry average through 2025 and into Q1 2026, while the conduct that produced Ofcom's largest ever fine for direct consumer harm ran from January 2022 to September 2024.
So what: a clean complaints line is not evidence of a clean compliance position. Enforcement risk in this sector is driven by breaches of the General Conditions and by direct evidence of consumer harm, which can be investigated over years and land long after the complaints series has moved on. Model the two exposures separately.
For consumers, Which?, Citizens Advice and the Communications Consumer Panel
The good news is real: even the worst figure in the broadband table, 10 per 100,000, is roughly one customer in ten thousand raising a complaint with Ofcom in a quarter. The harder news is that the table is now a weaker tie breaker than it was. Ofcom itself declares most broadband providers comparable to at least one neighbour.
So what: use the table to spot the outlier, not to split the field. In Q1 2026 the defensible statements are that TalkTalk is the most complained about broadband provider and Sky Mobile the most complained about mobile provider. Ranking Sky above Virgin Media, or BT above EE, is not supported by Ofcom's own comparability rules. For everything else, pair the table with price, speed, contract terms and the compensation record.
For housing developers, landlords and the civil engineering supply chain
Provisioning sits inside the largest complaint category across the fixed services. That covers the handover between a build programme, an ISP order journey and an engineer appointment, which is precisely where new build and multi dwelling connections fail.
So what: the complaints data does not break out new build or MDU premises, so the sector cannot see its own contribution. Developers and landlords negotiating wayleaves and connectivity commitments should ask retail partners for provisioning fail rates directly, because the public scoreboard will not surface them.
The acronym decoder: every term in this report, in plain English
This sector runs on acronyms, and they exclude people from conversations they have every right to be in. Every abbreviation used on this page is defined below. For the full site wide glossary of 645 terms, see the telecoms acronym decoder.
- ACSI
- A US satisfaction index running since 1994, scored 0 to 100. Its 2026 internet service provider score was 73.
- ADR
- A free, independent scheme that can rule on a complaint your provider has not resolved. Every UK provider must belong to one: CISAS or the Communications Ombudsman.
- ADSL
- Broadband delivered over a copper line running to the street cabinet and then to the premises. Ofcom counts ADSL inside its fixed broadband complaints category.
- Altnet
- An independent network builder competing with Openreach and Virgin Media O2. No altnet retail brand currently meets the 1.5% threshold, so none appears in this table.
- ARCEP
- Runs J'alerte l'Arcep, a public reporting platform, and normalises reports per 100,000 users as Ofcom does.
- BDUK
- Administers public broadband funding including Project Gigabit. Part of DSIT at the time of writing; gov.uk had not confirmed its home after the July 2026 changes.
- BEREC
- Coordinates the EU's national telecoms regulators. It does not publish a single pan-EU complaints league table.
- BNetzA
- The German federal network regulator. Publishes issue specific complaint counts rather than a per provider service quality league.
- CISAS
- One of the two Ofcom approved ADR schemes. Run by CEDR. Its decisions bind the provider, not you.
- Comparable
- Where the actual measurable difference between two providers is less than one complaint per 100,000, Ofcom states their performance should be treated as equivalent. This is central to reading the league table correctly.
- CSAT
- A transactional measure: how satisfied were you with this specific interaction. Distinct from NPS, which measures relational loyalty.
- DBIST
- Created in the machinery of government changes set out on 22 July 2026, merging DSIT with Business and Trade. Set to hold most national digital infrastructure policy.
- Deadlock letter
- A letter from your provider confirming it cannot resolve your complaint. It lets you go to ADR immediately rather than waiting the full six weeks.
- DSIT
- Being wound down from 22 July 2026. Created February 2023; functions split between DBIST, DCMS and the Cabinet Office. Still cited in earlier policy documents.
- FCC
- The US communications regulator. Serves informal complaints on carriers, who must respond within 30 days, rather than adjudicating them.
- FTTP
- Full fibre. An optical fibre running all the way into the building, with no copper in the final stretch.
- FWA
- Home broadband delivered over a mobile network. Ofcom excludes it from fixed broadband, but notes that where a provider sells both, FWA complaints cannot be separated out.
- General Conditions
- The conditions every UK communications provider must meet. Breaching them is what triggers enforcement, including the £28 million Virgin Media fine of July 2026.
- INCA
- The trade body representing UK alternative network builders.
- Industry average
- Total complaints for a service divided by the total subscribers of all providers included, per 100,000. It excludes providers below the 1.5% threshold.
- ISP
- The company that sells you your broadband connection. It may or may not own the network your connection runs over.
- MDU
- A block of flats or similar shared building. A common source of provisioning complaints because access usually requires a wayleave.
- MNO
- An operator that owns physical mobile infrastructure. In the UK these are EE, Virgin Media O2 and VodafoneThree.
- MSP
- An IT firm that bundles connectivity with services such as cloud, security and voice, usually for business customers.
- MVNO
- A mobile brand that rents capacity from an MNO rather than owning masts. Four of the eight brands in Ofcom's pay monthly mobile table are MVNOs.
- NPS
- A loyalty measure created at Bain & Company in 2003, based on how likely a customer is to recommend a provider.
- One Touch Switch
- You contact only the provider you are moving to. It handles the rest, including cancelling your old service, so you never have to phone your existing provider to leave.
- Openreach
- Builds and maintains the largest UK fixed access network, which most retail ISPs sell over. Regulated separately from BT's retail arm.
- Per 100,000
- Complaints divided by subscribers, times 100,000. Scaling is what lets a provider with ten million customers be compared fairly with one that has half a million.
- Provisioning
- Everything between placing an order and a working connection: the appointment, the engineer, the activation. It sits inside the largest complaint category in three of the four services.
- PSTN
- The UK's analogue telephone network. It closes on 31 January 2027, after which every landline must run over broadband.
- TrustScore
- Not a simple average. It weights recent reviews more heavily, rewards steady review collection, and seeds new profiles with a baseline, so volume dampens movement.
- UKCSI
- Published twice yearly by the Institute of Customer Service, scored 0 to 100. Telecommunications and Media scored 76.0 in January 2026.
- Wayleave
- The agreement a network builder needs from a landowner or landlord. A frequent cause of delay in flats and new developments.
Frequently asked questions
Which broadband provider has the most complaints in 2026?
TalkTalk. In Ofcom's Q1 2026 data, covering January to March 2026 and published on 23 July 2026, TalkTalk recorded 10 complaints per 100,000 customers. That is the highest of any UK broadband provider and unchanged for a third consecutive quarter. It is also the only broadband figure Ofcom does not declare statistically comparable to any other provider.
Which broadband provider has the fewest complaints?
Plusnet, at 4 complaints per 100,000 customers, against an industry average of 6. Ofcom names Plusnet and Sky, on 5, as the providers generating the fewest fixed broadband complaints in Q1 2026.
Are UK broadband complaints going up or down?
Down, and to a record low. Fixed broadband complaints to Ofcom fell to 6 per 100,000 customers in Q1 2026, the lowest figure in a published series that begins in Q4 2010, when the same measure stood at 35. Landline, pay monthly mobile and pay TV all equalled their lowest published levels in the same quarter.
Why does Ofcom say some providers are comparable?
Ofcom publishes complaints figures as whole numbers. Where the actual measurable difference between two providers is less than one complaint per 100,000 customers, Ofcom states their performance should be treated as equivalent. In Q1 2026 this applies to most of the broadband table, so a printed gap of one point between two providers does not mean one is genuinely better than the other.
Why are altnets not in the Ofcom complaints table?
Ofcom generally includes only providers with a stable market share of 1.5% or more in the relevant market. No alternative network retail brand currently meets that threshold, so none appears in the table. Ofcom states the providers it does include account for at least 95% of the fixed broadband market.
Is complaining to Ofcom the same as complaining to my provider?
No. Your provider must handle your individual complaint. If it is unresolved after six weeks, or sooner if you receive a deadlock letter, you can take it to a free Alternative Dispute Resolution scheme, either the Communications Ombudsman or CISAS. Ofcom does not resolve individual cases, but logging your complaint with Ofcom feeds this data and the regulator's monitoring, so it is still worth doing.
What compensation am I owed for broadband faults in 2026?
Under Ofcom's automatic compensation scheme, from 1 April 2026 signed up providers must pay £10.34 per day for a total loss of service not fixed after two full working days, £32.31 for a missed engineer appointment, and £6.46 per day for a delayed start to a new service. It is paid as a bill credit within 30 days without you asking.
Which mobile network has the most complaints in 2026?
Sky Mobile, at 4 complaints per 100,000 customers, was the most complained about pay monthly mobile provider in Ofcom's Q1 2026 data. EE, giffgaff and Vodafone generated the fewest, at 1 per 100,000. Ofcom states Sky Mobile's complaints were primarily driven by customers' experiences changing provider.
How often is this page updated?
This is the report of record for Ofcom's Q1 2026 release and its figures will not change. When Ofcom publishes Q2 2026, expected in autumn 2026, we will publish a new analysis and link it from this page. Anything we correct in the meantime is logged in our public corrections log.
Vote with your router
See how the least complained about providers price up at your address. Live deals from 30+ providers, independent, free, no signup.
Download the report
The Complaints Floor (Report No. 30) is the designed, citable edition of this analysis: 38 pages, landscape, with the full fifteen year trend chart, all four league tables, the complaint process mapped end to end, evidence grades on every source, and APA references. Free, no signup.
Download the PDF (38 pages, 3 MB) Machine readable data (api.json)
Cite as: BroadbandSwitch.uk, The Complaints Floor (Report No. 30), 28 July 2026, broadbandswitch.uk/reports/the-complaints-floor/.
Keep reading
- A Century in Red: 100 years of the red telephone box (Report No. 31)
- The 82% Country: Connected Nations Spring 2026 (Report No. 29)
- The Loyalty Penalty: what disengaged UK broadband customers really pay (Report No. 28)
- The Great Consolidation: forecasting the UK fibre shake out (Report No. 27)
- The Last Dial Tone: the PSTN switch off, explained and forecast (Report No. 26)
- Ofcom Complaints by Provider: the Q4 2025 edition of record
- Is TalkTalk being sold? What it means for your broadband
References, graded (APA 7th edition)
Every reference carries an evidence grade. Grade A, primary source: published by the organisation that produced the data. Grade B, reported source: trade press reporting on a primary release, used where we could not obtain the primary document directly. Grade C, our own working: data we captured or analysis we derived, reproducible from the method described. Where we could not confirm a specific page, the reference deliberately carries no link rather than a plausible looking one.
- A Ofcom. (2026, July 23). Complaints about broadband, landline, mobile and pay-TV services. ofcom.org.uk
- A Ofcom. (2026, July 23). Ofcom telecoms and pay-TV complaints fall to record low. ofcom.org.uk
- A Ofcom. (2026, July 23). Telecoms and pay-TV complaints Q1 2026: Summary data [Data set]. All provider figures in this report are taken from this file.
- A Ofcom. (2026, July 23). Telecoms and pay-TV complaints: Background and methodology, Q1 2026.
- A Ofcom. (2026, July 8). Ofcom fines Virgin Media £28m for repeatedly preventing customers from cancelling contracts. ofcom.org.uk
- A Ofcom. (2025, May 22). Telecoms companies up their game on complaint handling, but more to do to keep customers satisfied. ofcom.org.uk
- A Ofcom. (2024). Ofcom approved complaints code of practice, annex to General Condition C4. ofcom.org.uk
- A GOV.UK. (2026, July 22). Machinery of government changes: Fact sheet. gov.uk
- A American Customer Satisfaction Index. (2026, May 19). Telecommunications, cell phone, and smartwatch study 2026. Based on 26,963 completed surveys. theacsi.org
- A Institute of Customer Service. (2026, January). UKCSI Telecommunications and Media sector, January 2026. instituteofcustomerservice.com
- A Institute of Customer Service. (2026, January). UK Customer Satisfaction Index, January 2026. All sector score 78.2. instituteofcustomerservice.com
- A Federal Communications Commission. (n.d.). Consumer complaints data center. Live dashboard of informal complaints by issue category. fcc.gov
- A Federal Communications Commission. (n.d.). Consumer complaints charts and graphs. fcc.gov
- A ARCEP. (2025, April 3). Bilan annuel de J'alerte l'Arcep, édition 2025. arcep.fr
- B Jackson, M. (2026, July 23). TalkTalk attract most UK complaints for broadband and Sky Mobile for mobile in Q1 2026. ISPreview UK. ispreview.co.uk
- B Advanced Television. (2026, July 23). Ofcom: Broadband complaints at record low. advanced-television.com
- B thinkbroadband. (2026, July 23). Ofcom reports broadband customer complaints at lowest since 2011. thinkbroadband.com
- B thinkbroadband. (2026, July 20). Goodbye DSIT hello Department for Business, Innovation, Science and Trade. thinkbroadband.com
- B In Compliance Magazine. (2026, January). FCC releases annual robocall report. Source of the FCC informal complaint trend. incompliancemag.com
- B Bundesnetzagentur. (2025, January 15). Über 150.000 Beschwerden zum Rufnummernmissbrauch im Jahr 2024 [Press release].
- A Ofcom. (2025, April 10). Telecommunications market data update, Q4 2024. 29.2 million UK fixed broadband lines.
- C Martin-Smith, A. J. (2026, July 26). Trustpilot capture: seven UK provider profiles [Unpublished data set]. Scores and review counts recorded manually from each provider's main UK consumer profile.
About the author and BroadbandSwitch.uk

Dr Alex J. Martin-Smith CMgr MBA LLM DBA is Founder and Chief Executive of Upleashed Limited and Strategic Lead of the SearchSwitchSave Group. Adrian James, Sales Director and Broadband Editor at BroadbandSwitch.uk, is the editorial reviewer for this report.
BroadbandSwitch.uk is an independent UK broadband comparison and editorial site, part of the SearchSwitchSave Group. It publishes live comparison data for more than 30 UK providers alongside an ongoing industry research series. Our approach to data, ranking and corrections is documented in the methodology and trust hub.
Dr Alex J. Martin-Smith CMgr MBA LLM DBA · Founder, BroadbandSwitch.uk · Isle of Man, July 2026
About this report
Point in time: Published 28 July 2026. All data, prices, dates and product details were checked to 28 July 2026 and may change.
Forecasts are opinion, not advice: Part Three of this report contains forward looking analysis and a probability estimate. These represent the reasoned editorial opinion of the author based on cited evidence.
Independence: BroadbandSwitch.uk operates comparison services and may receive commission when readers switch provider through our links.
Trade marks: BT, Openreach, EE, Plusnet, Sky, TalkTalk, Vodafone, Virgin Media O2, giffgaff, Tesco Mobile, Three, iD Mobile, Utility Warehouse, NOW, Trustpilot and all other company and product names are the trade marks of their respective owners.
Corrections: We correct errors promptly and transparently. Spotted one? Email the editorial team via broadbandswitch.uk. Corrections are welcome, answered, and published in our public corrections log.
Publisher: © 2026 BroadbandSwitch.uk, a trading name of SearchSwitchSave® (Isle of Man company 030828B).
Suggested attribution: BroadbandSwitch.uk, The Complaints Floor (Report No. 30), 28 July 2026, broadbandswitch.uk.