BRIGHTON AND HOVE · THREE SEATS · 23 WARDS
Brighton and Hove broadband: ward by ward, and flat by flat
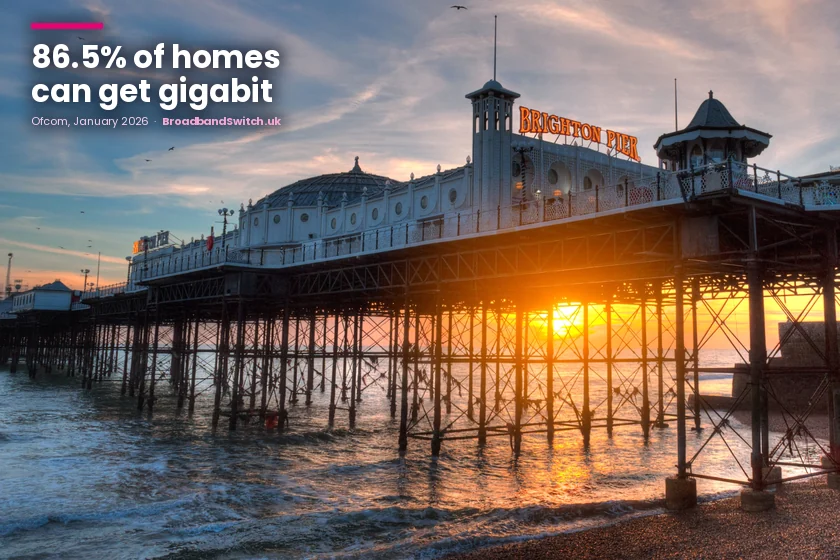
Brighton and Hove is a city of flats, and its broadband map shows it. Ofcom’s January 2026 count gave 86.5% of the city’s 135,309 homes a gigabit-capable line, and 67.4% the chance to order full fibre. England is ahead on both, at 89.5% and 82%, so there is ground to make up.
The gap is widest where big old houses have been split into flats. In Brunswick and Adelaide, on the Hove seafront, only 33.4% of homes could get gigabit. The good news is close at hand. In 47 of every 100 homes, full fibre is already at the door and simply has not been ordered, and the builders’ plans take it to 80.3% of homes by January 2029.
Every number below has a date and a source: Ofcom, the 2021 census, Openreach, the city council, or the network concerned. Inside are all 23 wards and three seats, each network in its own words, the exchanges losing copper and the change to phone lines on 31 January 2027. The postcode check settles your own address. Up the A23? Crawley has its own page.
Curious about your neighbourhood? Pick it on the ward card, or find its dot on the line of wards. Just want the cheapest deal? Skip to the postcode check.
First, your own front door
Direct answer: Most homes in the city can already choose a fast line, but the choice changes from door to door. Ofcom counted 86.5% of homes with a gigabit-capable line in January 2026 and 67.4% with full fibre. For the deals at your own door today, use the live list below.
Three layers of network run under Brighton and Hove. Openreach’s full fibre now reaches most streets, Virgin Media’s cable covers many of the homes it has not reached yet, and CityFibre, Grain and Brighton Fibre lay lines of their own. Each has built street by street, so your list can look quite unlike a friend’s two roads away. The networks section lets each one speak for itself.
Changing provider takes one order
Since 12 September 2024, home broadband has moved under Ofcom’s One Touch Switch rules. You no longer ring the company you are leaving: you order from the new one, it tells the old one, and both services hand over on the same day. Notice charges stop at the switch date too, so you are not paying twice.
Fibre and cable: what runs under the streets
Direct answer: Cable carries about a fifth of the city’s gigabit reach. Ofcom’s January 2026 files put full fibre within reach of 67.4% of homes and a gigabit-capable line of any kind within reach of 86.5%, a gap of 19.1 points. That leaves 25,857 homes where Virgin Media’s cable is the only gigabit line so far.
Ofcom, January 2026
Every 100 homes in the city, as pebbles on the beach
- 20already use full fibre
- 47have fibre at the door, waiting for an order
- 19get gigabit speeds only over Virgin Media cable
- 14are still waiting for any gigabit line
Three Ofcom measures for the city in January 2026, each rounded to the nearest pebble. They are the share of all homes using full fibre, the share that could order it, and the share with any gigabit-capable line, cable included.
Imagine the city as a beach of a hundred pebbles. In 20 of them, someone already has a full fibre line working, and 47 more could order one tomorrow. Another 19 rely on Virgin Media’s cable for gigabit speeds, and 14 are still waiting for any gigabit line. Across England the two measures sit only 7.5 points apart, so cable matters far more here than in most places.
Which kind of line suits you? Both cope easily with streaming, gaming and video calls. Full fibre deals tend to offer faster uploads, handy if you work from home or send large files, and many providers sell them on the same network. Only Virgin Media sells over its cable, so where a street has cable but no fibre, you have one gigabit seller for now. The 2029 plans show when that should change, and our upload speed guide explains the second number on every deal.
Below gigabit, the city is in good shape. Superfast speeds of 30Mbit/s or more reach 98.3% of homes, against 98.2% for England, and Ofcom’s count of homes without what it calls decent broadband is 0. The 1,299 homes below 30Mbit/s are bunched in a few places, as the next two sections show.
Converted houses and the gigabit gap
Direct answer: The wards where big houses have been split into flats have the fewest gigabit lines. In Brunswick and Adelaide, 58.7% of households lived in a converted flat in 2021, and 33.4% of homes could get gigabit in January 2026. In North Portslade, with 1.5% in converted flats, the figure was 99.6%.
Census 2021 and Ofcom, January 2026
More converted flats, fewer gigabit lines
- 1Brunswick and Adelaide 33.4% gigabit, 58.7% converted flats
- 2Central Hove 60.2% gigabit, 50.0% converted flats
- 3Kemptown 73.4% gigabit, 40.1% converted flats
- 4Regency 81.4% gigabit, 40.8% converted flats
- 5Round Hill 95.2% gigabit, 37.9% converted flats
- 6North Portslade 99.6% gigabit, 1.5% converted flats
Each dot is one of the 23 wards. Across: the share of households living in a flat carved out of a converted house or other building, from the 2021 census. Up: the share of homes able to get a gigabit-capable line in January 2026, our totals of Ofcom’s output areas. The faint line is our straight-line fit through the dots. The vertical scale starts at 30%.
Draw every ward as a dot and the slope is hard to miss. Of the five wards with the most converted flats, four are also among the five with the lowest gigabit shares: Brunswick and Adelaide, Central Hove, Kemptown and Regency. The fifth, Round Hill, bucks the trend at 95.2%, which shows that a street of converted houses can be wired well.
Why might converted houses lag? Ofcom records lines, not reasons, so treat what follows as a reading of the numbers rather than a finding. When a house is split into flats, the building often has one owner and each flat another, and a network needs the building owner’s signature, called a wayleave, before it can run fibre up a shared staircase. Gathering those signatures house by house takes time.
There is a bright side in the same wards. Superfast lines of 30Mbit/s or more reach 99.9% of homes in Brunswick and Adelaide and 98.1% in Central Hove, so most of those flats already have a good line, just not a gigabit one yet.
Living in a converted flat?
Start with the postcode check, because your own flat may be connected even where the ward average is low. If it is not, ask your freeholder or managing agent which networks have asked to come in, and whether they have said yes. The form the owner signs is set out in our wayleave explainer, and broadband for flats answers the other questions people ask.
West Hill, Regency and the slower lines
Direct answer: Two central wards, West Hill and North Laine and Regency, account for 560 of the 1,299 homes stuck below 30Mbit/s on Ofcom’s January 2026 count. Add Moulsecoomb and Bevendean and Kemptown, and four wards hold 66% of the slow lines, with only 20% of the homes.
Ofcom, January 2026
The slower lines, ward by ward, as a stick of rock
- 322in West Hill and North Laine, by the station
- 238in Regency, on the central seafront
- 156in Moulsecoomb and Bevendean, out along the Lewes Road
- 136in Kemptown, east along the seafront
- 118in Central Hove
- 98in Westbourne and Poets’ Corner
- 231in the other seventeen wards together
We sorted Ofcom’s January 2026 output areas into the city’s 23 wards using ONS’s lookup. The sections add back up to the 1,299 homes Ofcom counts below 30Mbit/s, and a longer section means a bigger share of them.
The two biggest clusters sit in the busiest part of town. West Hill and North Laine, by the station, has 322 homes below 30Mbit/s, and Regency, on the central seafront, has 238. Both are wards of flats: at the 2021 census, 72.9% of households in West Hill and North Laine lived in one, and 85.0% in Regency, where 61.3% rented privately.
West Hill and North Laine has also grown. Ofcom counts 6,759 homes there, 1,180 more than the households the census found in the same streets in 2021. Empty homes, holiday lets and new flats can all sit in that gap, and new blocks can take a while to show up in the returns networks send to Ofcom.
Moulsecoomb and Bevendean, out along the Lewes Road, is a different story. Its larger part, in the Kemptown and Peacehaven seat, reaches 98.0% gigabit with no slow lines at all. All 156 of its slow lines sit in the smaller part in Brighton Pavilion, 1,174 homes where gigabit reaches 68.1%, which points to a pocket of addresses rather than the whole ward.
Elsewhere the picture is bright. Not one home in Round Hill or Woodingdean is under 30Mbit/s, and the seventeen wards beyond the six in the stick of rock have only 231 slow lines between them.
Stuck on a slow line?
Run the postcode check first, since it looks at your own flat rather than the ward. If nothing faster turns up and your line cannot manage 10Mbps, you have a legal right to request a decent connection from BT, and our USO guide takes you through it. In halls of residence? Our page for student halls explains who runs the connection.
Three seats, drawn on the old wards
Direct answer: Brighton Kemptown and Peacehaven has the most full fibre of the three seats covering the city, 71.9%, and Hove and Portslade the least, 64.6%. Cable narrows the gap: Brighton Pavilion reaches 90.0% gigabit, Kemptown and Peacehaven 89.3% and Hove and Portslade 81.0%.
Ofcom, January 2026
Three seats as three piers: fibre first, then cable on the end
Brighton PavilionHollingdean and Fiveways, Patcham and Hollingbury, Preston Park, Regency, Round Hill, West Hill and North Laine; part of Coldean and Stanmer, Hanover and Elm Grove, Moulsecoomb and Bevendean, Westdene and Hove Park
70.6% full fibre +19.4 by cable
Brighton Kemptown and PeacehavenKemptown, Queen’s Park, Rottingdean and West Saltdean, Whitehawk and Marina, Woodingdean; part of Coldean and Stanmer, Hanover and Elm Grove, Moulsecoomb and Bevendean; and four Lewes wards
71.9% full fibre +17.4 by cable
Hove and PortsladeBrunswick and Adelaide, Central Hove, Goldsmid, Hangleton and Knoll, North Portslade, South Portslade, Westbourne and Poets’ Corner, Wish; part of Westdene and Hove Park
64.6% full fibre +16.4 by cable
Brighton and Hove, the cityall 23 wards
67.4% full fibre +19.1 by cable
Englandfor comparison
82.0% full fibre +7.5 by cable
- Full fibre planks
- Virgin Media cable, no fibre
- Open water: no gigabit line yet
Ofcom’s constituency file for January 2026, seats as drawn for the 2024 election, longest cable section first. Each pier’s pink planks are full fibre, its navy end is homes reached only by Virgin Media’s cable, and the open water is homes with neither. Brighton Kemptown and Peacehaven takes in four Lewes wards as well.
Brighton Pavilion shows the two layers most clearly. Full fibre is open to 70.6% of its homes, gigabit to 90.0%, and the 19.4 points in between are cable. With West Hill and North Laine and Regency both inside it, Pavilion also has 60% of the city’s slow lines, 779 homes in all.
Hove and Portslade, running west from Brunswick Town to Portslade, has 64.6% full fibre and 81.0% gigabit, the lowest of the three on both, though only 257 of its homes are below 30Mbit/s. Brighton Kemptown and Peacehaven crosses the city boundary: as well as its city wards, it takes in East Saltdean and Telscombe Cliffs, Peacehaven East, Peacehaven North and Peacehaven West, four wards of Lewes district. On our count its city part holds 34,762 homes and its Lewes part 10,650.
| Brighton Kemptown and PeacehavenKemptown, Queen’s Park, Rottingdean and West Saltdean, Whitehawk and Marina, Woodingdean; part of Coldean and Stanmer, Hanover and Elm Grove, Moulsecoomb and Bevendean; and four Lewes wards | 71.9% | 89.3% | 17.4 | 45,412 | 349 |
|---|---|---|---|---|---|
| Brighton PavilionHollingdean and Fiveways, Patcham and Hollingbury, Preston Park, Regency, Round Hill, West Hill and North Laine; part of Coldean and Stanmer, Hanover and Elm Grove, Moulsecoomb and Bevendean, Westdene and Hove Park | 70.6% | 90.0% | 19.4 | 49,761 | 779 |
| Hove and PortsladeBrunswick and Adelaide, Central Hove, Goldsmid, Hangleton and Knoll, North Portslade, South Portslade, Westbourne and Poets’ Corner, Wish; part of Westdene and Hove Park | 64.6% | 81.0% | 16.4 | 50,786 | 257 |
Seats as drawn for 2024, with today’s wards placed by ONS’s output area lookup. “Homes” is Ofcom’s residential premises count for January 2026, and “Cable gap” is gigabit minus full fibre, in percentage points. Kemptown and Peacehaven’s row includes its four Lewes wards. Click a heading to sort.
Why do some wards appear under two seats? The 2024 seats were drawn on the city’s old wards, which gave way to 23 new ones at the May 2023 elections. So four of today’s wards straddle a seat line. Coldean and Stanmer, Hanover and Elm Grove, and Moulsecoomb and Bevendean are shared by Kemptown and Peacehaven and Pavilion, and Westdene and Hove Park by Pavilion and Hove and Portslade.
Put the three seat parts inside the city together and they come to Ofcom’s city total, home for home. A seat is a big place, so read its figure as the wide-angle view; the ward line below zooms in. Unsure of your seat? Find your MP on the UK Parliament site works it out from a postcode.
Twenty-three wards on one line
Direct answer: Ofcom does not publish full fibre by ward, so we totalled its gigabit and superfast counts for each of the city’s 23 wards from the smallest areas it reports. Gigabit reaches 95% of homes or more in nine of them, led by North Portslade on 99.6%. Brunswick and Adelaide is the outlier, at 33.4%.
Ofcom, January 2026
Twenty-three wards on one line
- 1Brunswick and Adelaide 33.4%
- 2Central Hove 60.2%
- 3Kemptown 73.4%
- 4West Hill and North Laine 75.2%
- 5Regency 81.4%
We built each ward by adding up Ofcom’s January 2026 counts for the output areas ONS places in it, and the 23 wards together match Ofcom’s city row to the home. Below council level Ofcom publishes gigabit but not full fibre, so the dots show gigabit, cable included. The line starts at 30%.
Look along the line and most wards crowd towards the top. Woodingdean has 99.3%, Hangleton and Knoll 98.7% and South Portslade 98.3%. Superfast is close to universal too, with North Portslade, Woodingdean, and Hanover and Elm Grove each on 100.0%.
Brunswick and Adelaide stands alone at the far left. Of its 6,668 homes, 4,440 had no gigabit line in January 2026, so roughly three in ten could get one. Central Hove, next door, is at 60.2%. If you live in either, the 2029 plans are worth a look, because across the city they lift gigabit coverage to 91.7%.
These are the wards that came in at the May 2023 elections, under an Order made on 11 January 2023. In its words: “Brighton & Hove is divided into the 23 wards listed in column 1 of the table in the Schedule.” Between them they elect 54 councillors.
Every ward in one table: lines and homesshow the 23 wards
| Brunswick and AdelaideHove and Portslade | 33.4% | 99.9% | 9 | 58.7% | 59.4% |
|---|---|---|---|---|---|
| Central HoveHove and Portslade | 60.2% | 98.1% | 118 | 50.0% | 54.7% |
| Coldean and StanmerBrighton Pavilion and Brighton Kemptown and Peacehaven (split) | 91.7% | 93.9% | 29 | 3.8% | 19.7% |
| GoldsmidHove and Portslade | 87.1% | 99.5% | 10 | 29.5% | 43.8% |
| Hangleton and KnollHove and Portslade | 98.7% | 99.8% | 5 | 4.9% | 13.3% |
| Hanover and Elm GroveBrighton Pavilion and Brighton Kemptown and Peacehaven (split) | 96.2% | 100.0% | 2 | 20.6% | 36.8% |
| Hollingdean and FivewaysBrighton Pavilion | 96.6% | 97.4% | 6 | 14.4% | 19.5% |
| KemptownBrighton Kemptown and Peacehaven | 73.4% | 98.1% | 136 | 40.1% | 48.5% |
| Moulsecoomb and BevendeanBrighton Kemptown and Peacehaven and Brighton Pavilion (split) | 92.4% | 94.4% | 156 | 7.2% | 29.2% |
| North PortsladeHove and Portslade | 99.6% | 100.0% | 1 | 1.5% | 13.7% |
| Patcham and HollingburyBrighton Pavilion | 95.3% | 99.9% | 5 | 1.6% | 15.0% |
| Preston ParkBrighton Pavilion | 94.0% | 99.9% | 4 | 29.2% | 37.9% |
| Queen’s ParkBrighton Kemptown and Peacehaven | 94.7% | 99.3% | 37 | 16.7% | 29.5% |
| RegencyBrighton Pavilion | 81.4% | 96.2% | 238 | 40.8% | 61.3% |
| Rottingdean and West SaltdeanBrighton Kemptown and Peacehaven | 82.9% | 98.6% | 70 | 4.2% | 16.6% |
| Round HillBrighton Pavilion | 95.2% | 99.5% | 0 | 37.9% | 45.6% |
| South PortsladeHove and Portslade | 98.3% | 99.9% | 4 | 6.7% | 19.7% |
| West Hill and North LaineBrighton Pavilion | 75.2% | 90.8% | 322 | 29.9% | 52.6% |
| Westbourne and Poets’ CornerHove and Portslade | 89.4% | 98.0% | 98 | 31.1% | 33.8% |
| Westdene and Hove ParkHove and Portslade and Brighton Pavilion (split) | 91.7% | 99.7% | 19 | 3.4% | 14.4% |
| Whitehawk and MarinaBrighton Kemptown and Peacehaven | 95.8% | 97.7% | 20 | 3.4% | 24.6% |
| WishHove and Portslade | 92.0% | 99.8% | 10 | 18.8% | 25.5% |
| WoodingdeanBrighton Kemptown and Peacehaven | 99.3% | 100.0% | 0 | 1.4% | 12.6% |
Coverage columns: our totals of Ofcom’s January 2026 output areas, each placed in a ward by ONS’s lookup. Housing columns: shares of 2021 census households, with anyone living rent free counted among private renters. Click a heading to sort.
Building wards from output areas means an edge can stray by a street from the official boundary, yet the 23 still total Ofcom’s city figure. The homes are counted in January 2026 and the households in 2021, so recent building shows as extra homes. For your own address, the postcode check is the one to trust.
Along the south coast and next door
Direct answer: Of five south coast cities, Brighton and Hove comes fifth for full fibre, at 67.4%, and fifth for gigabit, at 86.5%. Southampton leads on both, with 95.8% and 97.9%. Of England’s 84 councils with more than 100,000 homes, only four have less full fibre: Enfield, Haringey, Hounslow and Cornwall.
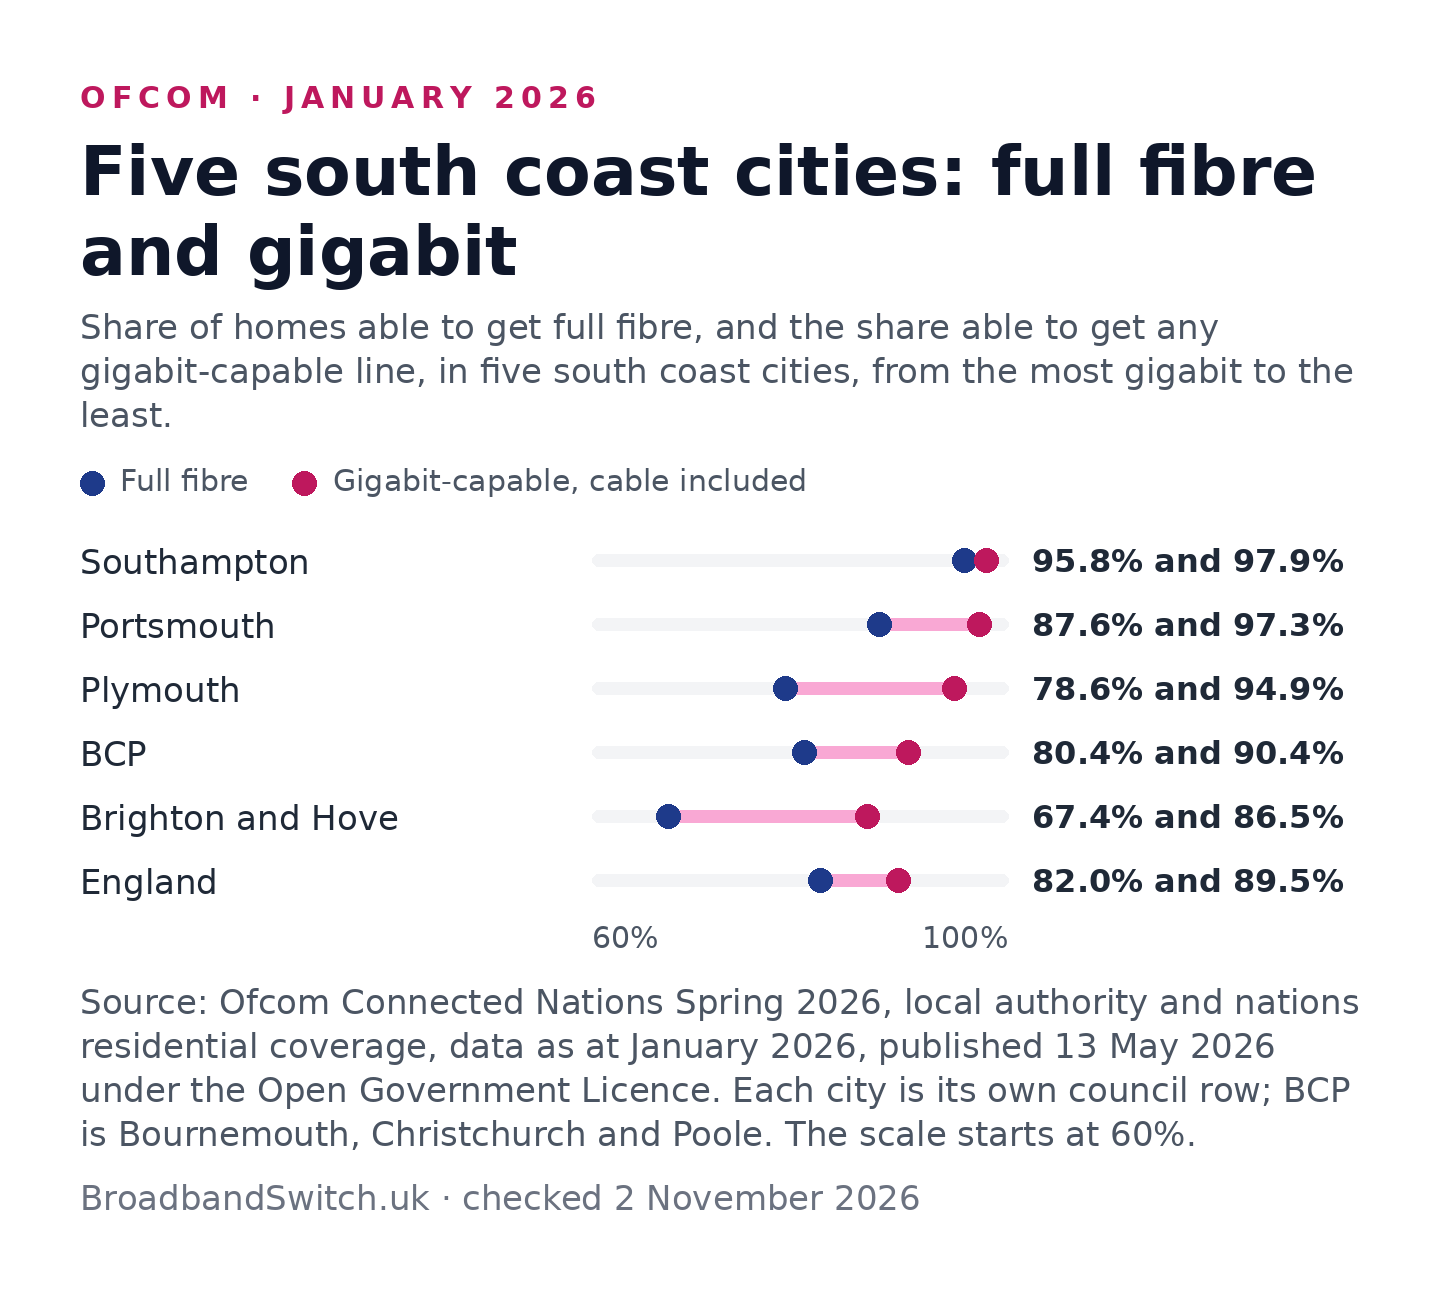
Each of the five, the city, Southampton, Portsmouth, Plymouth, and the Bournemouth, Christchurch and Poole conurbation, is measured on its council boundary. The city’s cable gap, 19.1 points, is the widest of the five, and among all 296 English councils it ranks 198th for gigabit and 262nd for full fibre. A slow start has an upside for you, though: the take-up section shows how many homes could upgrade without anyone digging.
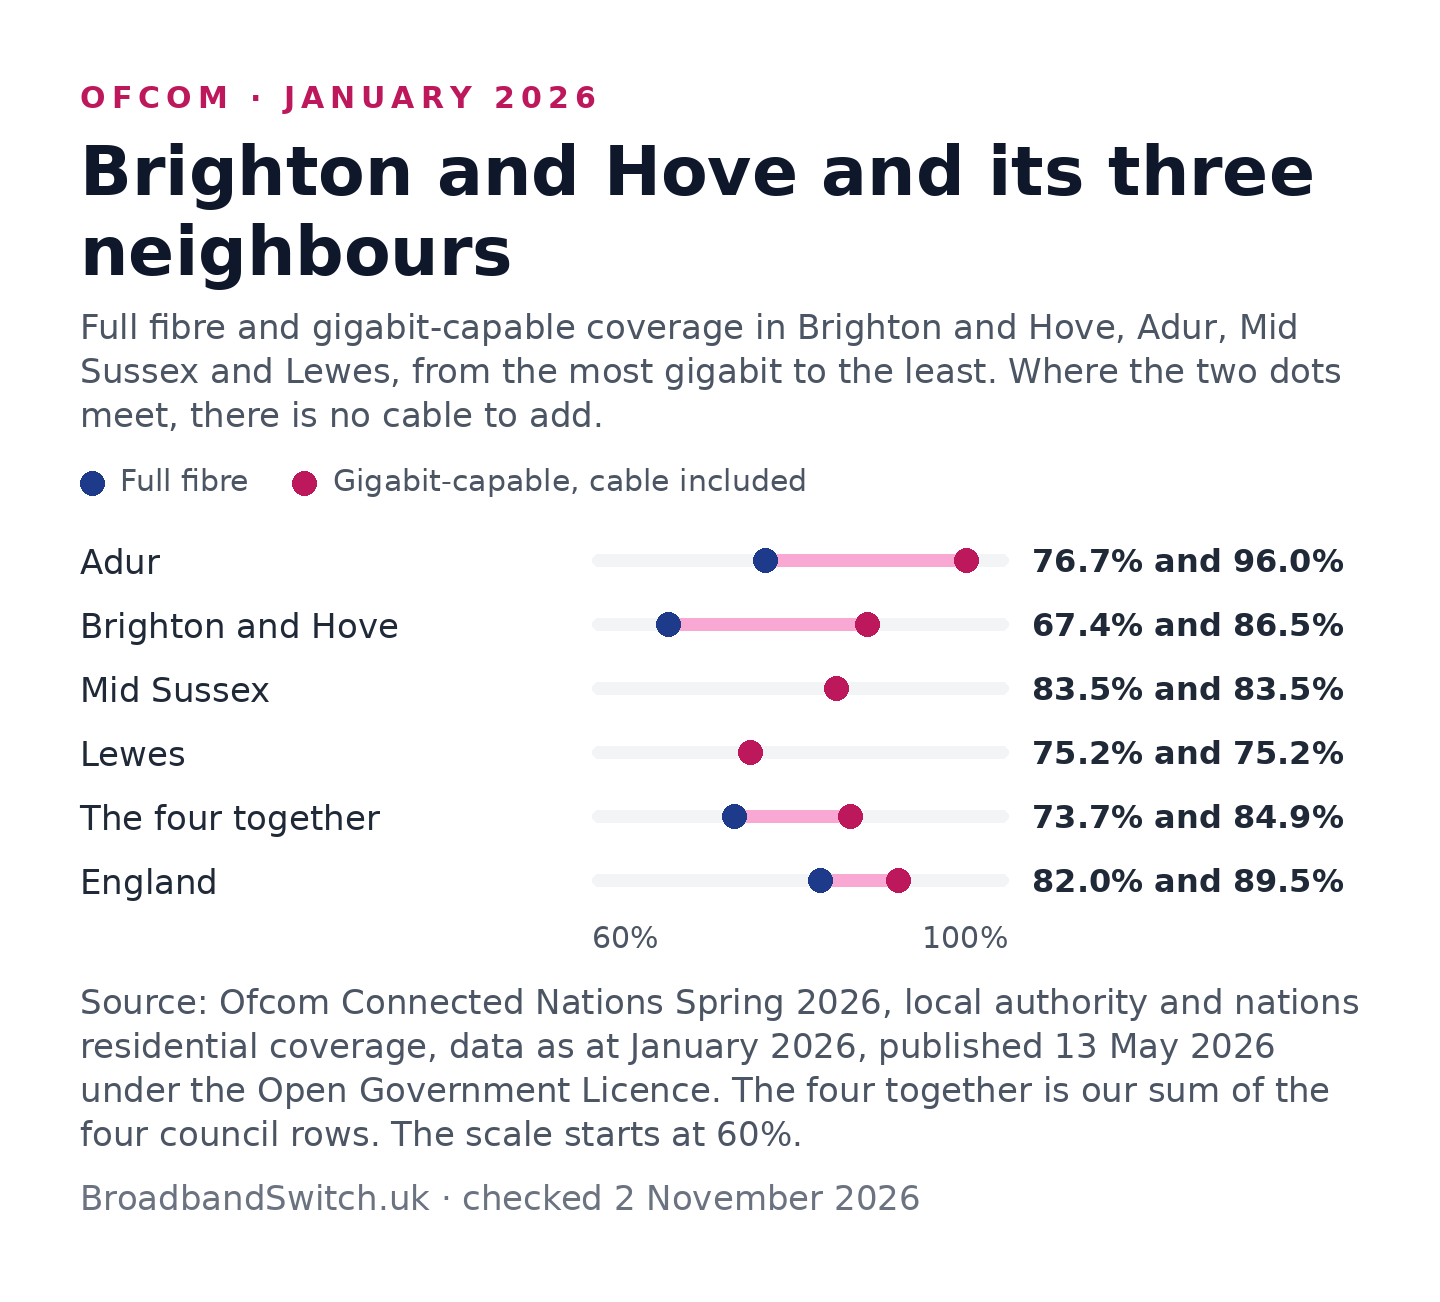
Next door, Adur, the strip from Shoreham to Lancing, has the most gigabit of the four at 96.0%, much of it cable, while Mid Sussex leads for full fibre at 83.5%. In Lewes, full fibre and gigabit are both 75.2%, so there is no cable to add. The city holds 48% of the homes in the four, and together they reach 73.7% full fibre on our sum. Live near the edge of the city? These tables follow council lines, so your own postcode tells you more than any of them.
The 2029 plans: the tide coming in
Direct answer: On the builders’ forecasts to Ofcom, full fibre in the city climbs from 67.4% now to 80.3% by January 2029, a rise of 12.9 points. That still trails England’s 92.2% and the other four south coast cities, and leaves 26,645 homes outside every full fibre plan for now.
Ofcom, January 2026 and plans to 2029
The tide is coming in: full fibre now, and the 2029 high-water mark
95.8%now
97.6%2029
Southampton
78.6%now
95.5%2029
Plymouth
87.6%now
94.4%2029
Portsmouth
80.4%now
91.7%2029
BCP
67.4%now
80.3%2029
Brighton and Hove
82.0%now
92.2%2029
England
- Full fibre, January 2026 (Ofcom)
- High-water mark: the builders’ plans for January 2029
Water level: full fibre coverage in January 2026, from Ofcom’s Connected Nations. Dashed mark: where the networks told Ofcom’s Planned Network Deployments 2026 they expect to be by January 2029. BCP is Bournemouth, Christchurch and Poole, England’s 2029 mark is our weighting of the council rows, and the gauges start at 60%.
Counted in homes, the plans bring full fibre to 17,432 that cannot get it today. The same plans put gigabit at 91.7%, with England on 95.3%, and Ofcom’s file expects 6 to 10 gigabit-capable operators to be working in the city by 2029. For most streets, then, the question will be which network you pick, not whether one turns up.
Why does a second network matter? It means more providers bidding for your custom. The plans give 65.5% of homes two gigabit networks or more, below England’s 74.0%, and 10.6% three or more. Where Virgin Media’s cable is the only gigabit line today, the next one will most likely be full fibre.
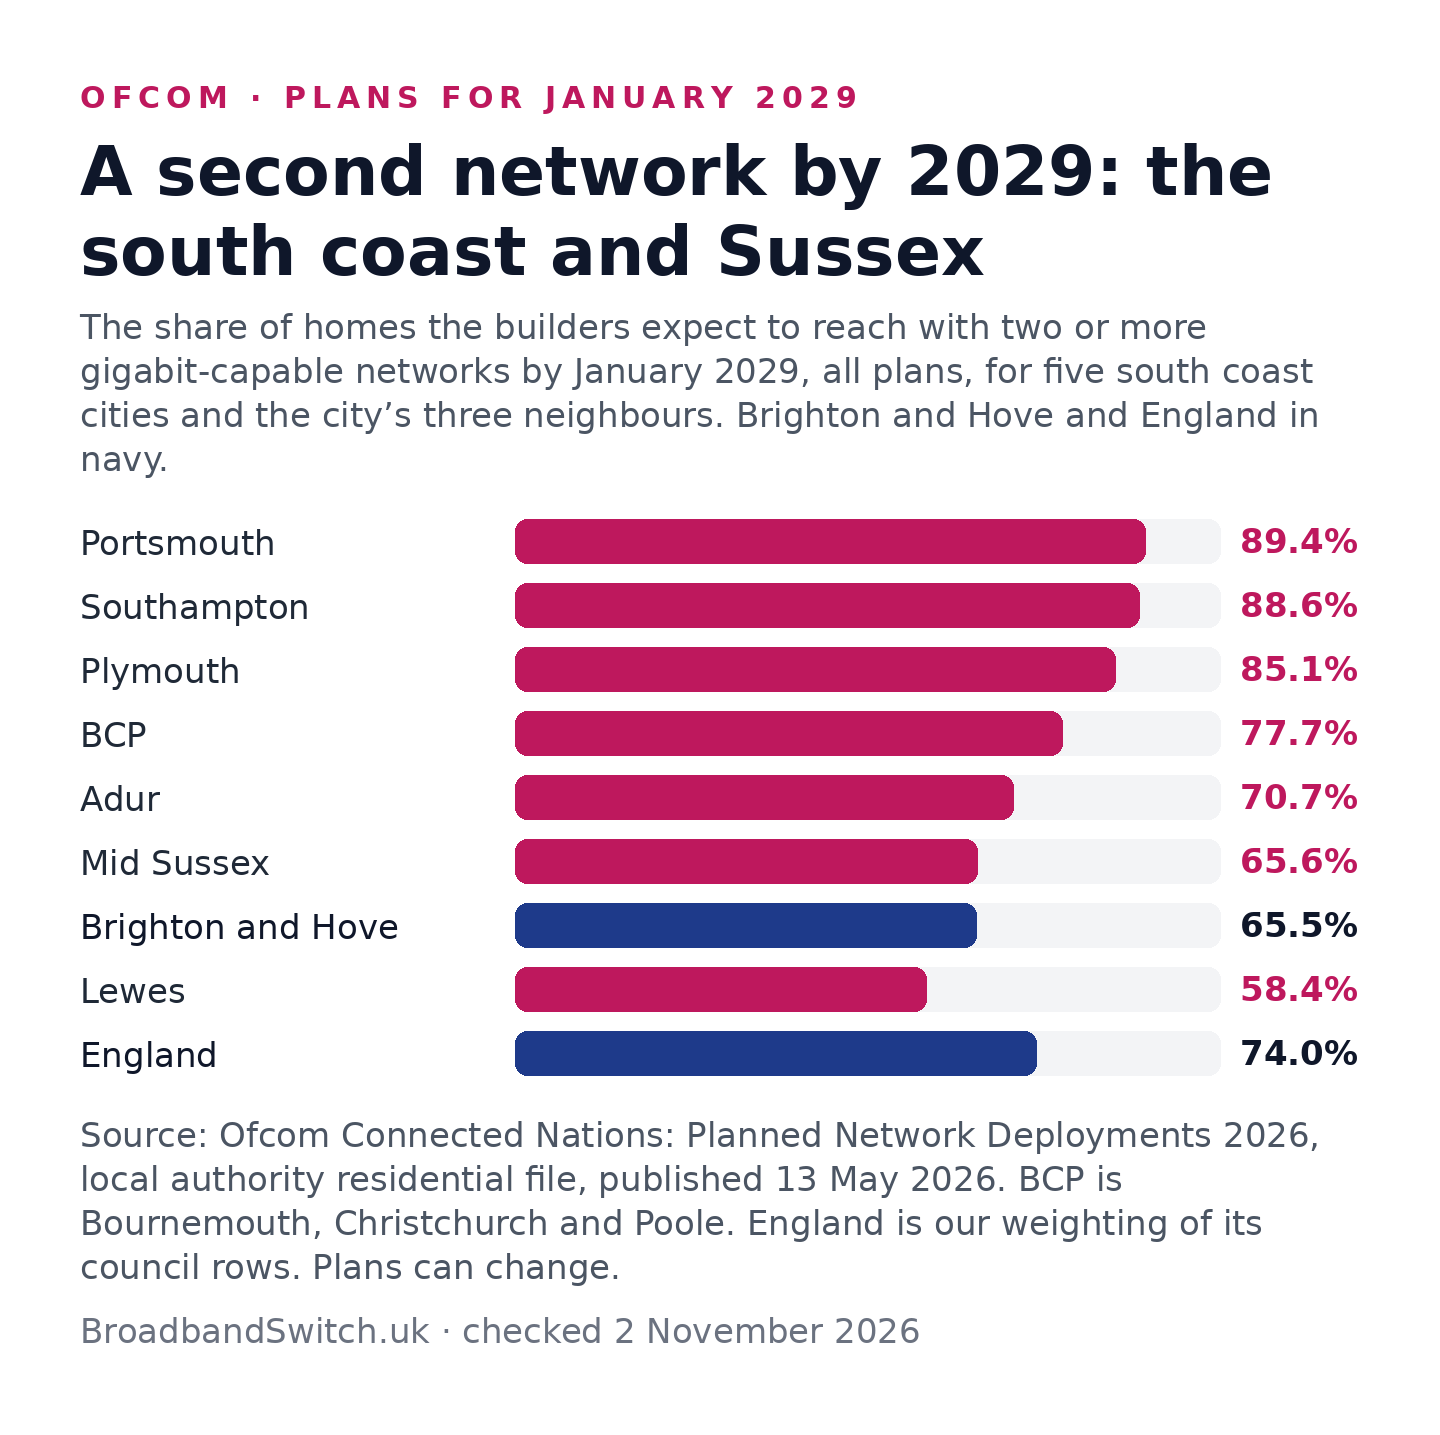
Public money is not part of the city’s plans: Ofcom’s file counts 0 planned lines here paid for from public funds. Across the county, the Project Gigabit contract for East and West Sussex was redesigned in May 2026 to cover around 13,000 premises with £25.2 million, down from around 52,000 and £100 million. Building Digital UK explains: “The contract redesign minimises overlap with other suppliers’ commercial rollout”.
Ofcom sets the bar for a decent connection at “a download speed of at least 10 Mbit/s and an upload speed of at least 1 Mbit/s”. If your line falls short, the Universal Service Obligation is how you ask BT for something better. Ofcom’s file also lists 245 city postcodes with no gigabit plan at all. These 2029 numbers are the networks’ own forecasts, so they can slip or grow.
Ordering the upgrade: the biggest open door
Direct answer: Only 29% of the homes able to order full fibre in January 2026 had actually done so. That is the lowest of the eight councils in the bunting, where England’s figure on our weighting of Ofcom’s rows is 46.2%. Turn it round and it means most homes with fibre at the door have an easy upgrade waiting for them.
Ofcom, January 2026
Bunting: how many homes have ordered the fibre
- Mid Sussex
- Southampton
- Lewes
- Adur
- BCP
- Portsmouth
- Plymouth
- Brighton and Hove
The dashed line marks England, 46.2%
Each flag is filled to the share of homes that could order full fibre in January 2026 and had done so, as Ofcom rounds it for each council. The England line is our weighting of all 296 council rows by the homes each one covers.
Openreach sees the same on its lines, which carry BT, EE, Sky, TalkTalk and many smaller providers. Its release of 2 February 2026 opened: “More than 90,000 homes and businesses in Brighton and Hove now have access to Full Fibre”. It credits £27m of spending with reaching “around 63 per cent of properties in the area” with gigabit-capable broadband. Kieran Wines, its partnership director for London and the South East, added: “We want to make sure everyone knows what’s available and how to get it.”
That count covers homes and businesses on Openreach’s own network. Ofcom, counting every network, put 100,157 of the city’s 145,440 homes and businesses in range of full fibre in January (68.9%), so no more than about 10,157 could rely on another network alone. Openreach has moved quickly: it reported more than 50,000 on 7 November 2024, so it added about 40,000 in fifteen months.
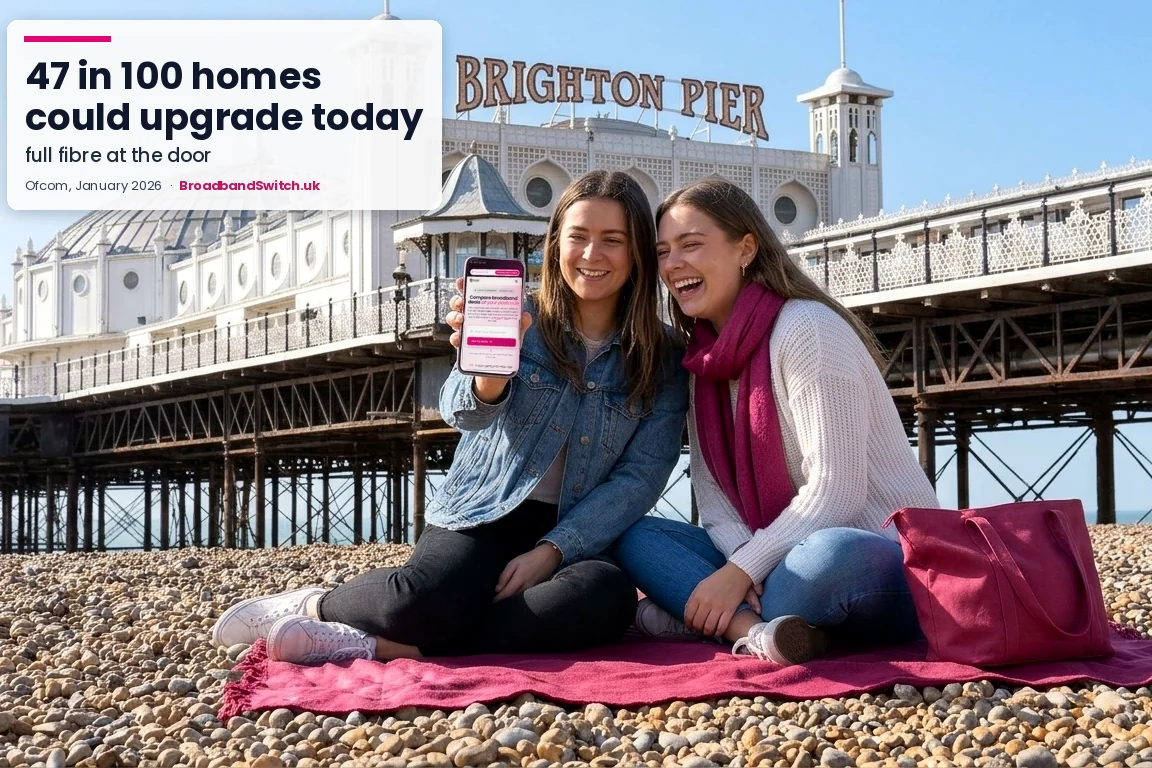
Fibre already in your street?
Then the digging is done, and your upgrade is a few clicks away. Nothing changes on its own, though: in Openreach’s words, “you need to place an order with your chosen provider”. Pop your postcode in the box at the top, and see whether a faster deal costs you any more than the one you have.
Of the 296 English councils, the city comes 280th for take-up, and counting every home, fibre or not, 20% now use a full fibre line. When Openreach reported on its own network in November 2024, it found “just 26 per cent of people adopting the service where it’s available”.
Who builds what under the city
Direct answer: Openreach runs the biggest full fibre network here, reaching more than 90,000 homes and businesses by its own figures. Most of the other gigabit lines are Virgin Media cable. CityFibre has been building across the city since 18 February 2021, and Grain and Brighton Fibre run networks of their own.
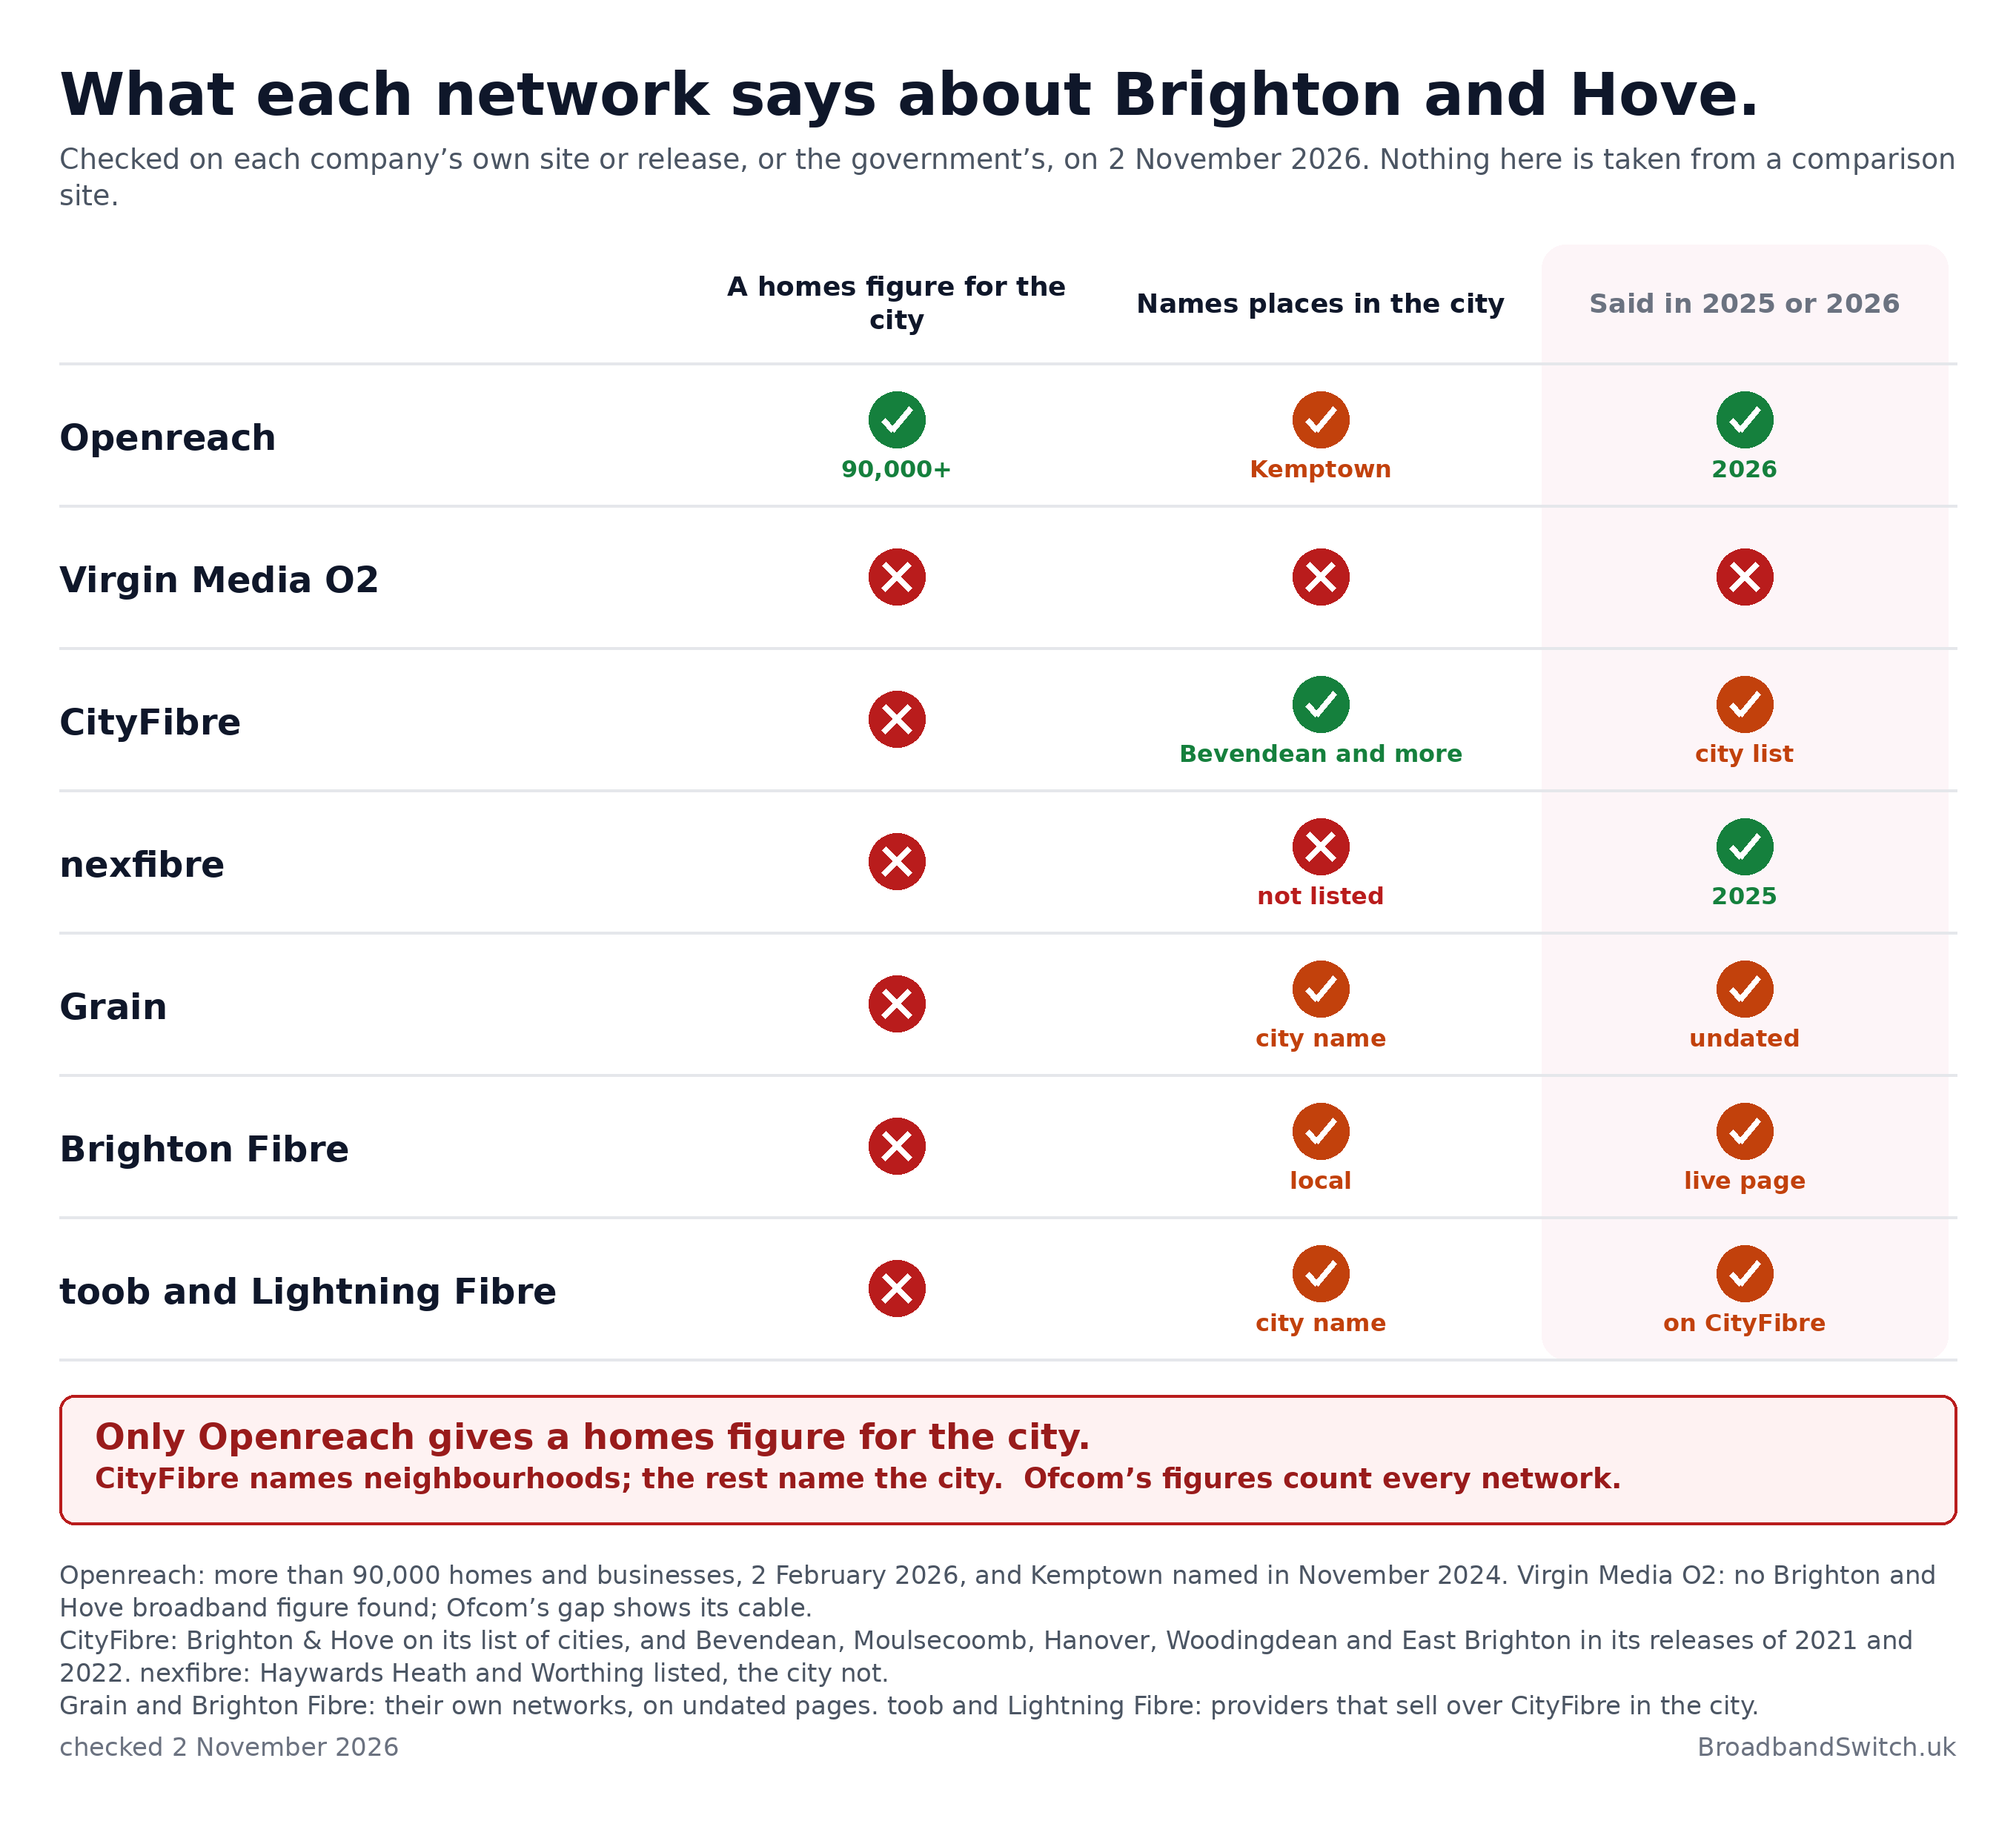
CityFibre, toob, Openreach, Ofcom and BDUK
How full fibre reached the city, 2021 to 2029
- 18 February 2021CityFibre starts digging in BevendeanAn £80m private build for the whole city, with the rest to follow over the next four to five years.
- 9 November 2022CityFibre’s first homes are readyIn Moulsecoomb & Bevendean, and in parts of Hanover & Elm Grove, Woodingdean and East Brighton.
- 29 May 2023More providers join CityFibretoob arrives in Worthing, Brighton and Hove on CityFibre’s network.
- 7 November 2024Openreach passes 50,000Homes and businesses able to order its full fibre, with Kemptown next.
- January 2026Ofcom counts 100,157 premisesHomes and businesses able to get full fibre from any network: 68.9% of them.
- 2 February 2026Openreach passes 90,000After £27m of investment in the city.
- January 2029The plans: 80.3% of homesFull fibre on the builders’ forecasts to Ofcom, if they hold.
Dates from the companies’ own releases: CityFibre in 2021 and 2022, toob in 2023, Openreach in 2024 and 2026. The January 2026 and 2029 points are Ofcom’s. Openreach counts its own network only; Ofcom counts every network.
First, two words that often get mixed up. Your provider is the company on the bill, and the network is the company whose cable reaches your door. Some providers use one network and some use several, so the networks at your address set your shortlist. Not sure which you are on? Ask your provider, or see how to check your network, because the answer decides whether a switch needs an engineer.
Openreach: the largest network
Most of the big names sell over Openreach, BT, EE, Sky, TalkTalk, Vodafone and Plusnet among them. On 2 February 2026 it put its reach in the city at more than 90,000 homes and businesses. That was up from more than 50,000 on 7 November 2024, when it had “engineers currently extending the Full Fibre broadband network to reach more properties in the east side of the city, including Kemptown”.
Virgin Media: the cable layer
Cable is why the city’s gigabit figure sits so far above its full fibre figure. Those 19.1 points add up to 25,857 homes that can get gigabit from Virgin Media but cannot yet order full fibre. Virgin Media O2 publishes no broadband figure for the city that we could find. Its sister network nexfibre lays new full fibre for Virgin Media to sell, and its list as at Haywards Heath and Worthing takes in 31 December 2025, but not Brighton or Hove. Our Virgin Media page covers the deals.
The same owners have agreed to buy Substantial Group, which runs the Netomnia network and the YouFibre brand, through nexfibre. News of the £2 billion deal came on 18 February 2026, and on 1 July 2026 the Competition and Markets Authority began an in-depth inquiry. It asked for views on possible remedies on 20 October 2026 and must decide by 15 December 2026, so nothing is settled yet. Our altnet consolidation tracker follows each step.
CityFibre: building since 2021
CityFibre lists Brighton & Hove among the cities its network serves. It began work on 18 February 2021 with an £80m private build aimed at “almost every home and business locally”. It said then: “Construction work has officially commenced in Brighton & Hove’s Bevendean area, with the rest of the city set to follow over the next 4 to 5 years.” Its first homes were ready on 9 November 2022, in Moulsecoomb & Bevendean, and in parts of Hanover & Elm Grove, Woodingdean and East Brighton. Its coverage page adds: “As availability can vary between properties, use the availability checker above for the latest information about your address.” Across the UK, its update of 6 October 2026 counts 4.8m premises passed.
Providers on CityFibre: toob and Lightning Fibre
Some providers sell over CityFibre here rather than building lines of their own. On 29 May 2023, the provider toob announced: “Full-fibre broadband provider toob launches its service to Worthing, Brighton and Hove today partnering with CityFibre”. Lightning Fibre, from Eastbourne, describes its role like this. “We are also partnered with City Fibre and act as an ISP (internet service provider) for them, which means that in areas where we do not operate our own Full Fibre infrastructure, we can access the City Fibre network instead.” Its list of areas covered names Eastbourne and Polegate, Hastings and St Leonards, Hailsham, Heathfield and Broad Oak, and Tenterden. Its about page says: “Covering towns and cities including Eastbourne, Hastings, Hailsham, St Leonard’s, Brighton & Hove, Worthing, Heathfield and Broad Oak.” Our toob page sets out what it sells.
Grain and Brighton Fibre: networks of their own
Grain tells the city: “We’re now live with our gigabit Full Fibre broadband service.” It adds that “we own our network from end-to-end”. Brighton Fibre, a local network, opens its home page with “Full fibre, built here.” It also says: “We build, light, monitor, repair and support the network ourselves.” Neither gives a homes figure, so the postcode check is how you find out whether either reaches your door.
Hyperoptic: whole buildings, not streets
Hyperoptic wires blocks one at a time. Its press page reads: “Our network now passes more than 2 million homes.” It describes itself as follows: “We focus exclusively on high density urban areas”. It does not list those areas, and no Hyperoptic page we found names a building in the city. The postcode check will tell you if your block is one. Our Hyperoptic page has the details.
Leaving the old phone network
Direct answer: The old analogue phone network closes for good on 31 January 2027. On 30 October 2026, Openreach said approximately one million copper-based lines remain active across the UK, and its regional breakdown puts 250,473 of them in London and South East, the region that includes the city. That is the biggest number of the seven regions.
Openreach, 30 October 2026
About a million old lines to go, by region
London and South East250,473
Wales and Midlands233,033
Northern England207,135
Wessex156,141
Scotland112,794
East Anglia99,050
Northern Ireland32,809
One square stands for 10,000 lines, rounded.
Openreach’s “Regional Breakdown of Legacy Lines Remaining”, in its release of 30 October 2026, with one square for every 10,000 lines. The seven regions add up to 1,091,435, which Openreach rounds to about one million. Brighton and Hove sits in London and South East.
James Lilley, Director of All-IP at Openreach, put it plainly: “The straightforward migrations have largely been completed.” What remains are the trickier connections. Openreach’s list of systems still relying on the old network includes “Lift emergency telephones and auto-diallers” and “Building access controls, automated gates, and door entry units”. That matters in a city of flats: if you live in a block, ask your managing agent whether the lift phone and the door entry have moved over.
Anyone still on the old network on that day may be moved to a stopgap service called EVAc. Openreach is clear about it: “EVAc is a temporary safety net with limited capacity, and it is significantly more expensive than the modern digital alternatives already available.” In most homes, though, all that changes is where the phone plugs in: the router, not the wall.
Plan for power cuts. A digital phone works through the router, so when the power or the broadband goes down, so does the phone, including calls to 999, as BT’s Digital Voice help page warns. Anyone at home who relies on that phone? Ask your provider for a battery back-up before the switch.
Using CareLink Plus?
The council describes the service like this: “CareLink Plus is Brighton & Hove City Council’s community telecare alarm service.” It provides an alarm unit that plugs into your telephone line, and it needs an available electric socket to power the CareLink Plus alarm unit which must remain switched on at all times. For homes with no line there is already an answer: “If you don’t have a landline telephone connection we can supply a unit that uses the mobile network, subject to sufficient signal strength in your home.” The council adds: “Our Brighton based monitoring centre operates 24 hours a day every day of the year.” If your alarm unit uses the phone socket, ring CareLink Plus on 0300 123 3301 before the line moves, and let your broadband provider know as well. Our care alarm guide has a checklist, and our landline switch-off checker takes any city number.
Three exchanges and copper’s last call
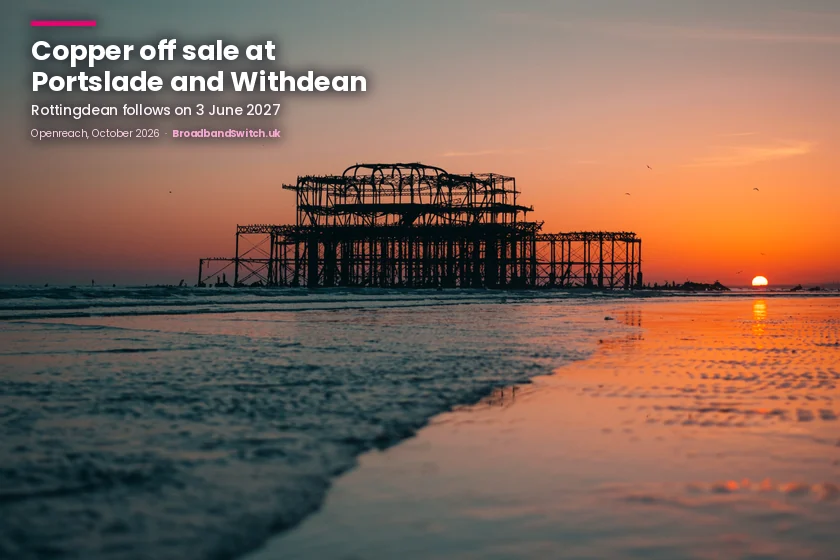
Direct answer: Openreach’s stop sell list names one exchange under the location Brighton and Hove, Withdean, where copper broadband went off sale on 26 May 2025. Portslade, filed under Portslade-by-Sea, went first, on 17 February 2025, and Rottingdean, filed under Saltdean, follows on 3 June 2027.
Openreach, 8 October 2026
Copper’s last call, stop by stop along the coast
Inland, behind the Downs
- Warninglid4 June 2024Off sale
- Poynings4 June 2024Off sale
- Bolney8 November 2024Off sale
- Hassocks (HSA)3 June 2027Due
- Haywards Heath6 November 2025Off sale
- Lindfield26 May 2025Off sale
- Barcombe (QBC)4 November 2027Due
The coast and the city, west to east
- Lancing9 November 2023Off sale
- Southwick19 August 2026Off sale
- Portslade17 February 2025Off sale
- Withdean26 May 2025Off sale
- Rottingdean3 June 2027Due
- Peacehaven5 June 2026Off sale
- Newhaven19 August 2026Off sale
- Seaford5 June 2026Off sale
Stops are in west-to-east order and evenly spaced, not to scale. Pink rings mark the three exchanges named after places in the city.
Openreach’s stop sell list of 8 October 2026: the three exchanges named after places in the city, Portslade, Withdean and Rottingdean, with the twelve around it that this page lists, filed under other places.
Stop sell and the phone switch-off are separate things, on separate timetables. Openreach waits until full fibre reaches a majority (>75%) of premises served by an exchange, then gives providers a year’s notice. From then on, homes there that can get fibre are switched to it whenever they order something new, while homes without fibre stay on copper. The analogue phone network has its own closing date: 31 January 2027.
Why so few exchanges for a city this size? An exchange joins the list only when most premises it serves can get full fibre, and with 67.4% full fibre the city’s central exchanges have not reached that mark. Around the city, ten of the twelve exchanges this page lists have already stopped selling copper, from Lancing, on 9 November 2023, to Southwick and Newhaven, on 19 August 2026.
The fifteen exchanges, code by codeshow the table
| Code | Tranche | List last changed | ||
|---|---|---|---|---|
| Portsladefiled under Portslade-by-Sea | SDPRTSL | 15 | 9 October 2024 | 17 February 2025 |
| Withdeanfiled under Brighton and Hove | SDWTHDN | 16 | 22 April 2024 | 26 May 2025 |
| Rottingdeanfiled under Saltdean | SDRTTNG | 24 | 8 May 2026 | 3 June 2027 |
| Lancingfiled under Shoreham-by-Sea | SDLNCNG | 10 | 10 July 2023 | 9 November 2023 |
| Poyningsfiled under Henfield | SDPYNNG | 12 | 31 May 2023 | 4 June 2024 |
| Warninglidfiled under Warninglid | SDWRNNG | 12 | 31 May 2023 | 4 June 2024 |
| Bolneyfiled under Bolney | SDBLNY | 14 | 6 October 2023 | 8 November 2024 |
| Lindfieldfiled under Haywards Heath | SDLNDFL | 16 | 22 April 2024 | 26 May 2025 |
| Haywards Heathfiled under Haywards Heath | SDHYWRD | 18 | 9 October 2024 | 6 November 2025 |
| Peacehavenfiled under Peacehaven | SDPCHVN | 20 | 2 May 2025 | 5 June 2026 |
| Seafordfiled under Seaford | SDSFRD | 20 | 2 May 2025 | 5 June 2026 |
| Newhavenfiled under Newhaven | SDNWHVN | 21 | 18 July 2025 | 19 August 2026 |
| Southwickfiled under Southwick (West Sussex) | SDSTHWC | 21 | 8 May 2026 | 19 August 2026 |
| Hassocks (HSA)filed under Hurstpierpoint | SDHSSCK | 24 | 8 May 2026 | 3 June 2027 |
| Barcombe (QBC)filed under Barcombe Cross | SDBRCMB | 26 | 8 October 2026 | 4 November 2027 |
The three pink rows carry the names of places in the city; the others sit under nearby place names. A row in italics is still to come. We label Openreach’s “Last amended date” column as “List last changed”, because it records when a row was added or moved, and that need not be the day providers were told. Exchanges take the name of their building, so to find yours, use Openreach’s address checker. Click a heading to sort.
What stop sell means for you
- Staying put on your current deal? Nothing changes, and the one date for everybody is 31 January 2027.
- Changing deal where copper is off sale? If fibre reaches you, your next order will be on fibre.
- Fibre not at your door yet? Copper stays until it is.
Based on Openreach’s Tranche 24 announcement of 15 May 2026 and its stop sell list of 8 October 2026, version 35.
Moving to a new flat in the city? Check the new postcode before you move, so the line is ready when you are. Our stop sell explainer has the national picture, and Openreach adds new rounds every few months.
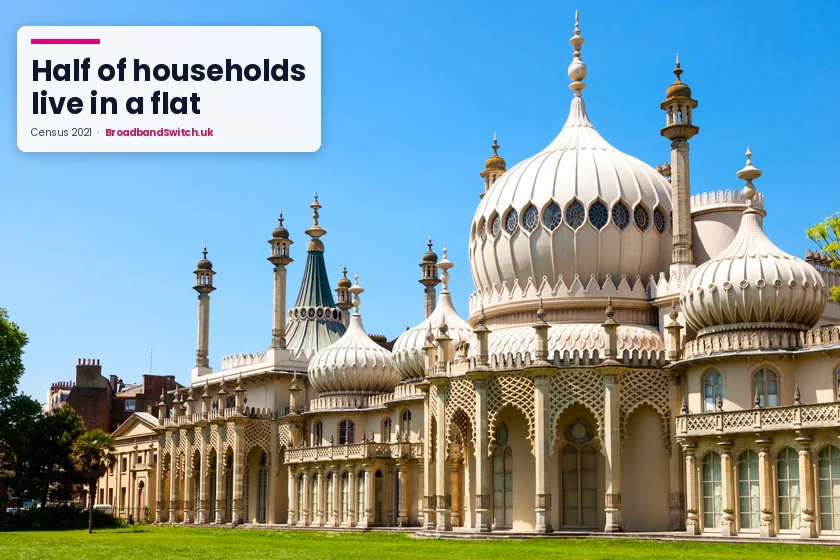
Half the city lives in a flat
Direct answer: At the 2021 census, 50.0% of the city’s households lived in a flat, against 22.2% across England. In a converted house or building it was 21.1%, about 5 times England’s 4.3%. Outside London, no English council has more of either.
Census 2021
A hundred windows each: who lives in a flat
Brighton and Hove
flats of every kind 50.0%
England
flats of every kind 22.2%
Brunswick and Adelaide
converted flats 58.7%
Hanover and Elm Grove
terraced houses 51.1%
- A flat in a converted house or building
- A flat in a purpose-built block
- A flat over a shop or in a commercial building
- A house or bungalow, or a caravan
From census table TS044, households, through nomis, for the city, England and two wards at opposite ends. A terrace has a hundred windows, one for each household in a hundred, coloured by the kind of home behind it.
Among all 296 English councils, the city ranks 7th for converted flats and 17th for flats of every kind, and every council above it on both is a London borough. Purpose-built blocks hold 27.6% of households, and only 10.3% live in a detached house, against 22.9% across England. Private renting is common too, at 32.9% against 20.6%.
The wards could hardly be more different. In Brunswick and Adelaide, 92.9% of households live in flats and 59.4% rent privately. Hanover and Elm Grove is the city’s terraced quarter, with 51.1% in terraced houses, and Rottingdean and West Saltdean has 57.8% in detached houses. Whitehawk and Marina has the most social renting, with 34.7% renting from the council.
What does that mean for your connection? It decides whose permission new cabling needs. In a terraced or detached house, fibre usually comes in from a pole or an underground duct to a small box indoors, often in a single visit. In a flat, purpose-built or converted, the building’s owner says yes first: for social housing that is the council or a housing association, and elsewhere a freeholder or managing agent. Our wayleave guide walks through the paperwork.
Renting? Drilling needs your landlord’s say-so, and our tenant rights guide covers what to do if the reply never comes. Moving to a new provider on your existing line is your call alone, as our renters’ guide explains. The council counts 34,695 students at the city’s two universities in 2024 to 2025, though it notes not all students at the two universities live in Brighton & Hove, so plenty of homes are shared. Our student guide and our house share guide can help.
Paying less: social tariffs
Direct answer: Claim Universal Credit, Pension Credit or one of several other benefits? Then you can probably get a social tariff: a low-cost deal from a major provider that you can leave at any time without a fee.
In the city, 14.9% of households rent from a social landlord, against 17.1% across England, and 9.5% rent from the council. The tariffs open to you depend on the networks at your address. Over Openreach, BT Home Essentials costs £16.50 a month, and Vodafone Essentials is £20 a month, up to 80 Mbps, on a contract of 12 months. Virgin Media offers its own, Essential Broadband, on cable. Ofcom lists 33 social tariffs in all, and our social tariff guide sets out who qualifies for each.
Your postcode results always start with the cheapest deal at your address, so you can see straight away whether a social tariff beats the standard deals where you live.
Look up your ward
Direct answer: Choose your ward from the list of 23. A card then shows how its lines compare with the rest of the city, which seat it sits in, and who lives there by the 2021 census. The card is built in your browser, and your choice is not sent anywhere.
Your corner of the city, on one card
Lines are counted from Ofcom’s January 2026 output areas, households from the 2021 census. Don’t know your ward? The council’s website finds it from your address, and the UK Parliament’s Find your MP finds your seat from a postcode.
What the old page got wrong
Direct answer: We corrected twelve claims from the old page. It set coverage too high, gave Virgin Media and premises figures with no source, quoted average speeds nobody can check, and placed CityFibre, Lightning Fibre and Hyperoptic where their own pages do not. It also counted brands and a CityFibre retreat we could not trace, treated a takeover as done, mixed up the phone switch-off and used an old student number.
The earlier page ran to more than thirteen thousand words, much of it undated prices and long lists of providers. Here, a figure stays only when we can point to where Ofcom, the census, the council or the company itself published it; anything else has been cut, not reworded. The price tables are gone as well, because prices are national and your postcode results carry today’s.
Coverage pitched too high
What it saidThe old page put full fibre at “approximately 69%” and gigabit at “approximately 92%”. For January 2026, Ofcom’s files give 67.4% and 86.5%, across 135,309 homes, so both were a few points too generous.
What we use nowOfcom’s files, city, seats and wards.
A Virgin Media share we could not trace
What it saidA cable share of “approximately 80.47%” appeared with no source, to two decimal places. We could find no such figure from Virgin Media O2 or Ofcom. What Ofcom does show is the cable layer on its own: 25,857 homes, or 19.1 points, with gigabit by cable and no full fibre.
What we use nowThe cable gap in Ofcom’s own figures.
A premises count with no source
What it saidThe old page gave “approximately 143,491” premises without saying where it came from. Ofcom’s files for January 2026 count 135,309 homes, and 145,440 homes and businesses together, and those are the figures every share on this page uses.
What we use nowOfcom’s own premises counts.
Average speeds with no source
What it saidTwo average download speeds, for 2019 and 2025, appeared with no source. Averages like these usually come from crowd-sourced tests, which depend on who runs them and on what kit, so we have taken them out and kept to Ofcom’s coverage figures.
What we use nowOfcom’s coverage, not crowd-sourced averages.
CityFibre’s neighbourhoods, and networks said not to overlap
What it saidThe old page listed ten CityFibre areas, Southwick among them, and said CityFibre and Openreach “often serve different Brighton streets”. CityFibre’s own releases name Moulsecoomb & Bevendean, and in parts of Hanover & Elm Grove, Woodingdean and East Brighton, and Southwick lies in Adur. Openreach alone reaches more than 90,000 of the 100,157 premises Ofcom counts with full fibre, so the networks overlap far more than the old page suggested.
What we use nowCityFibre’s own releases and Ofcom’s premises count.
A count of brands we could not trace
What it saidAbout 35 retail brands on CityFibre were claimed, with no source. The figure we can stand behind is CityFibre’s own, from 9 November 2022: residents could sign up to Vodafone, as well as TalkTalk, Giganet, IDnet, Yayzi, Air Broadband, NoOne and Octaplus, which is eight providers. Any that sell at your address appear in the postcode check.
What we use nowCityFibre’s dated list of providers.
Lightning Fibre’s network placed in the city
What it saidLightning Fibre was said to offer “up to 2 Gbps symmetric in parts of eastern Brighton”, as if on its own network. Its areas covered page names Eastbourne and Polegate, Hastings and St Leonards, Hailsham, Heathfield and Broad Oak, and Tenterden, and its FAQs explain that it uses CityFibre’s network where it does not run its own. In the city, that makes it a provider on CityFibre.
What we use nowLightning Fibre’s own areas page and FAQs.
No building we could find
What it saidThe old page placed Hyperoptic “in Brighton Marina apartment buildings and other central apartment blocks”. We found no Hyperoptic page naming any building in the city, so we removed it. Hyperoptic says “We focus exclusively on high density urban areas”, and a block it serves will appear in the postcode check.
What we use nowHyperoptic’s own words, and a block-by-block check.
A takeover written up as done
What it saidThe old page wrote up Netomnia’s sale as an acquisition already made. It is a deal agreed on 18 February 2026 that the Competition and Markets Authority has been examining in depth since 1 July 2026, with its decision due by 15 December 2026.
What we use nowThe CMA’s live case, dated.
A CityFibre retreat we could not find
What it saidThe old page said CityFibre had halted commercial building outside Project Gigabit areas. Nothing CityFibre has published that we can find says so, and its trading update of 6 October 2026 reports 4.8m premises passed, so the line has been removed.
What we use nowCityFibre’s own October 2026 update.
The phone switch-off and copper broadband mixed up
What it saidThe old page gave a single switch-off date for “copper phone lines”, which runs two changes together. On 31 January 2027 the analogue phone network shuts, and calls go digital. Copper broadband runs to a different clock, exchange by exchange, and nobody without full fibre loses it.
What we use nowTwo dates, two changes, kept separate.
A student number that had drifted
What it saidThe old page gave “approximately 42,000 students” across the two universities. The council’s own population summary counts 34,695 in 2024 to 2025, and notes that not all students at the two universities live in Brighton & Hove.
What we use nowThe council’s latest figure, dated.
FAQ: Brighton and Hove broadband questions, answered
How much of Brighton and Hove can get full fibre?
67.4% of homes, on Ofcom’s January 2026 count, against 82% across England. Add Virgin Media’s cable and 86.5% could get a gigabit-capable line.
Can I get gigabit broadband in Hove?
In most of Hove, yes, though it varies more than in Brighton. Hove and Portslade reaches 81.0% gigabit, the lowest of the three seats, with Brunswick and Adelaide at 33.4% and Central Hove at 60.2%, while North Portslade has 99.6%. Your postcode gives the answer for your home.
Why is broadband slower in some seafront flats?
The figures point to converted houses. The wards with the most flats inside converted houses have the lowest gigabit shares, and a network needs the building owner’s permission to run fibre up a shared staircase. Superfast still reaches 99.9% of homes in Brunswick and Adelaide.
Is Virgin Media available in Brighton and Hove?
In much of the city, yes. There are 25,857 homes where Ofcom finds gigabit but no full fibre, and in those it is Virgin Media’s cable doing the work. Your postcode check will say whether it serves your street.
Is CityFibre in Brighton and Hove?
Yes. CityFibre lists Brighton & Hove among the cities its network serves, started building in Bevendean on 18 February 2021, and had its first homes ready on 9 November 2022. Providers such as toob and Lightning Fibre sell over it.
Where in the city is broadband slowest?
In a handful of central wards. West Hill and North Laine and Regency hold 560 of the 1,299 homes below 30Mbit/s, and four wards together hold 66%. Round Hill and Woodingdean have none at all.
Will more homes get full fibre by 2029?
The networks’ plans say so: from 67.4% to 80.3% by January 2029, with 65.5% of homes offered two or more gigabit networks. That would still leave 26,645 homes outside every full fibre plan, so check again as the dates get closer.
How many homes have upgraded to full fibre?
29% of homes that could get it, as of January 2026: the lowest of the eight councils on this page, and well short of the 46.2% we work out for England. Most homes with fibre outside can upgrade with no digging at all.
Which exchanges have stopped selling copper?
Portslade, from 17 February 2025, and Withdean, from 26 May 2025. Rottingdean follows on 3 June 2027. Wherever you are, copper stays until full fibre reaches your home.
When do landlines in the city go digital?
The analogue network shuts across the whole UK on 31 January 2027, so the city changes over with everyone else. In most homes the phone just plugs into the router after that.
Does CareLink Plus need my landline?
Not necessarily. In the council’s words: “If you don’t have a landline telephone connection we can supply a unit that uses the mobile network, subject to sufficient signal strength in your home.” If yours does use the landline, phone CareLink Plus on 0300 123 3301 before the line goes digital.
I rent a flat. Is the broadband my choice?
Usually. You can switch provider over the existing line without asking anyone. Drilling or a new line needs your landlord to agree, and in a converted house the freeholder as well. With 32.9% of the city’s households renting privately, it is worth asking before you sign.
Is there cheaper broadband if I am on benefits?
There probably is. Ofcom lists 33 social tariffs, low-cost deals for people on Universal Credit, Pension Credit and some other benefits, and BT Home Essentials, one of them, costs £16.50 a month.
In short: Brighton and Hove in eight points
- On Ofcom’s count for January 2026, 86.5% of the city’s homes could get a gigabit-capable line and 67.4% full fibre, both below England.
- Virgin Media’s cable fills a gap of 19.1 points, the widest of five south coast cities.
- The wards with the most converted flats have the fewest gigabit lines; Brunswick and Adelaide is lowest, at 33.4%.
- Two central wards, West Hill and North Laine and Regency, hold 560 of the city’s 1,299 homes below 30Mbit/s.
- In 47 of every 100 homes, full fibre is at the door and not yet ordered; take-up is 29%.
- The builders’ plans take full fibre to 80.3% by January 2029.
- Copper is off sale at Portslade and Withdean, Rottingdean follows in 2027, and the analogue phone network closes on 31 January 2027.
- Ward and city figures only go so far: for your own flat or house, the postcode check shows every network and price in a few seconds.
Every point carries its own date, so it can be quoted on its own. We look at the page again at least once a quarter, most recently on .
References
- OFCOM.ORG.UK
Ofcom. (2026, May 13). Connected Nations, Spring 2026 update. The council, constituency, output area and nations files for January 2026, Open Government Licence: the source of each coverage and take-up figure. Downloaded 2 November 2026.
- OFCOM.ORG.UK
Ofcom. (2026, May 13). Planned network deployments 2026. What each council’s networks expect by January 2029, for homes: full fibre, gigabit, second and third networks, operator counts, postcodes left out and public funding. Downloaded 2 November 2026.
- NOMISWEB.CO.UK
ONS Census 2021, read through the nomis API. (2023). Tables TS044 (accommodation type) and TS054 (tenure): the city and its 936 output areas, its neighbours, the south coast cities, England, and every English council. Read 2 November 2026.
- STATISTICS.GOV.UK
ONS Open Geography Portal. (2025). Output area to ward (May 2025) and output area to Westminster seat (2024) lookups, used to place each output area in a ward and a seat. Read 2 November 2026.
- LEGISLATION.GOV.UK
The Brighton & Hove (Electoral Changes) Order 2023, SI 2023/22, made 11 January 2023; and the Parliamentary Constituencies Order 2023, Schedule 1, Part 6 (South East). Read 2 November 2026.
- BRIGHTON-HOVE.GOV.UK
Brighton and Hove City Council. (2026). Healthy city JSNA population summary, and CareLink Plus service information. Read 2 November 2026.
- OPENREACH.COM
Openreach. (2026, February 2). Thousands in Brighton and Hove yet to benefit from major broadband upgrade; and (2024, November 7), Full Fibre reaches more than 50,000 Brighton and Hove properties. Read 2 November 2026.
- OPENREACH.COM
Openreach. (2026, October 30). Openreach warns businesses: fewer than 100 days left to move off the old analogue phone network, with its regional breakdown; and (2026, May 15), its Tranche 24 announcement. Read 2 November 2026.
- OPENREACH.CO.UK
Openreach. (2026, October 8). The FTTP priority exchange stop sell list, version 35, for the code, tranche, last amended date and order restriction date of each exchange on this page. Read 2 November 2026.
- CITYFIBRE.COM
CityFibre. (2021, February 18) and (2022, November 9), its Brighton and Hove releases; (n.d.), Network availability and coverage; and (2026, October 6), trading update. Read 2 November 2026.
- GOV.UK
Building Digital UK. (2024, February 6; updated 2026, October 23). Project Gigabit network build contract - East and West Sussex; and the Competition and Markets Authority’s nexfibre and Substantial case page. Read 2 November 2026.
- NEXFIBRE.CO.UK
nexfibre. (2026, February). Network coverage update to 31 December 2025, and the announcement of the Substantial Group purchase. Read 2 November 2026.
- TOOB.CO.UK
toob. (2023, May 29). Its launch in Worthing, Brighton and Hove. Read 2 November 2026.
- LIGHTNINGFIBRE.CO.UK
Lightning Fibre. (2026). FAQs, areas covered and about us. Read 2 November 2026.
- GRAINCONNECT.COM
Grain. (n.d.). Grain goes live with Full Fibre broadband in Brighton. Read 2 November 2026.
- BRIGHTONFIBRE.COM
Brighton Fibre. (2026). Home page. Read 2 November 2026.
- HYPEROPTIC.COM
Hyperoptic. (2026). News and press, with its own description of its network. Read 2 November 2026.
- PARLIAMENT.UK
UK Parliament. (n.d.). Find your MP, which gives your constituency from a postcode. Read 2 November 2026.
How switching works
Switching in Brighton and Hove: three steps
- Step 1Enter your postcode, then your flat or house
In a converted house, each flat can have its own line, so pick your own door.
- Step 2See every deal side by side
Providers on Openreach, Virgin Media’s cable, CityFibre and the local networks appear together, cheapest first, and looking is free.
- Step 3Order, and let the new provider do the rest
One order is enough: your new provider tells the old one and lines up the handover, so there is no gap and no double billing.
One Touch Switch covers every home in the city, from Portslade to Rottingdean.
What can your Brighton and Hove address get?
Type your postcode, pick your flat or house, and see each provider that can connect you, fibre or cable, lowest price at the top. The rest of this page is about the city; this bit is about your home.
Compare at my postcode →