Press release

13.9m UK homes and businesses can get full fibre but have not yet ordered it

UK Broadband in Numbers, a free monthly tracker from BroadbandSwitch.uk, brings 37 sourced figures together, with full fibre take-up for all 361 councils.

  • London
  • 7 minute read
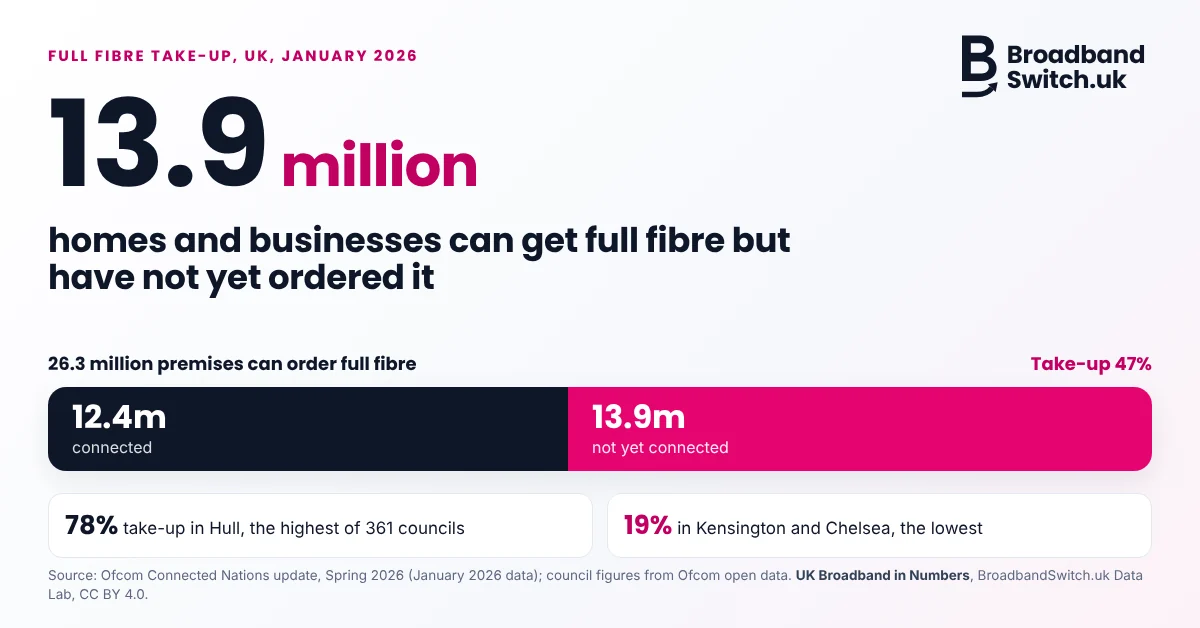
Chart from UK Broadband in Numbers by BroadbandSwitch.uk headed 13.9 million homes and businesses can get full fibre but have not yet ordered it.  A bar splits the 26.3 million premises that can order full fibre into 12.4 million connected and 13.9 million not yet connected, a take-up of 47%, with panels reading 78% take-up in Hull, the highest of 361 councils, and 19% in Kensington and Chelsea, the lowest.
26.3 million UK premises can order full fibre: 12.4 million are connected and 13.9 million are not yet, a take-up of 47%.  Ofcom Connected Nations update, Spring 2026 (January 2026 data).  Chart: UK Broadband in Numbers, BroadbandSwitch.uk Data Lab, CC BY 4.0.

The short answer

What is UK Broadband in Numbers?

A free tracker from the BroadbandSwitch.uk Data Lab that puts 37 figures on UK broadband in one place: coverage, take-up, speeds, prices and service.  Every figure shows its source, the date of the data, how it was worked out and when it next changes, and the tracker is updated on the first working day of every month.

Its headline this month: 13.9 million UK homes and businesses can order full fibre but have not yet done so.  See all 37 figures.

  • 13.9 millionUK premises can order full fibre and have not yet connectedOfcom, January 2026 data
  • 47%full fibre take-up where it is availableOfcom, January 2026 data
  • 78% to 19%take-up by council, from Hull to Kensington and ChelseaOfcom open data, January 2026
  • 6broadband complaints per 100,000 customers, April to June 2026Ofcom, published 26 October 2026

Has full fibre reached your street?

Enter your postcode to see the broadband deals available at your address, lowest monthly price first.  Availability and prices vary by postcode and by provider.  Or use the full fibre availability checker.

13.9 million UK homes and businesses could order full fibre broadband today but have not yet done so, according to Ofcom data brought together in UK Broadband in Numbers, a new free monthly tracker from the BroadbandSwitch.uk Data Lab.

Full fibre now reaches 26.3 million premises, and 12.4 million of them have a live connection, a take-up rate of 47% (Ofcom, January 2026 data).  Take-up varies widely across the country, from 78% in Hull to 19% in Kensington and Chelsea.  Five of the ten council areas with the highest take-up are in Northern Ireland, while Leeds stands at 50%, Glasgow at 43% and Birmingham at 37%.  The council figures come from Ofcom's own data, not a survey.
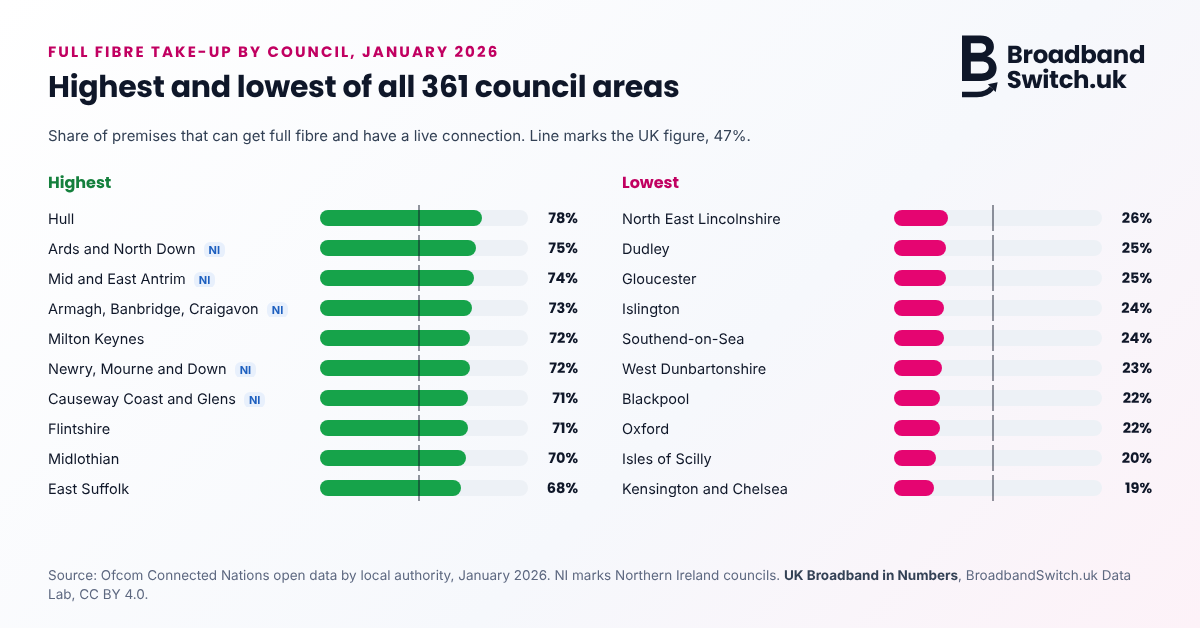
Two bar charts of full fibre take-up by council area, January 2026, with a line marking the UK figure of 47%.  Highest: Hull 78%, Ards and North Down 75%, Mid and East Antrim 74%, Armagh, Banbridge and Craigavon 73%, Milton Keynes 72%, Newry, Mourne and Down 72%, Causeway Coast and Glens 71%, Flintshire 71%, Midlothian 70%, East Suffolk 68%.  Lowest: North East Lincolnshire 26%, Dudley 25%, Gloucester 25%, Islington 24%, Southend-on-Sea 24%, West Dunbartonshire 23%, Blackpool 22%, Oxford 22%, Isles of Scilly 20%, Kensington and Chelsea 19%.
Full fibre take-up by council area, January 2026: Hull is highest at 78% and Kensington and Chelsea lowest at 19%, against 47% for the UK.  Five of the top ten are in Northern Ireland.  Source: Ofcom Connected Nations open data by local authority.  Chart: UK Broadband in Numbers, BroadbandSwitch.uk Data Lab, CC BY 4.0.  Open full size.

What is in UK Broadband in Numbers?

UK Broadband in Numbers sets out 37 figures on coverage, take-up, speeds, prices and service in one place.  Each figure shows its source, the date of the data, how it was worked out and when it will next change.  The tracker draws on Ofcom, the Office for National Statistics, Building Digital UK, Openreach and other named sources, and it is updated on the first working day of every month.

How the tracker works

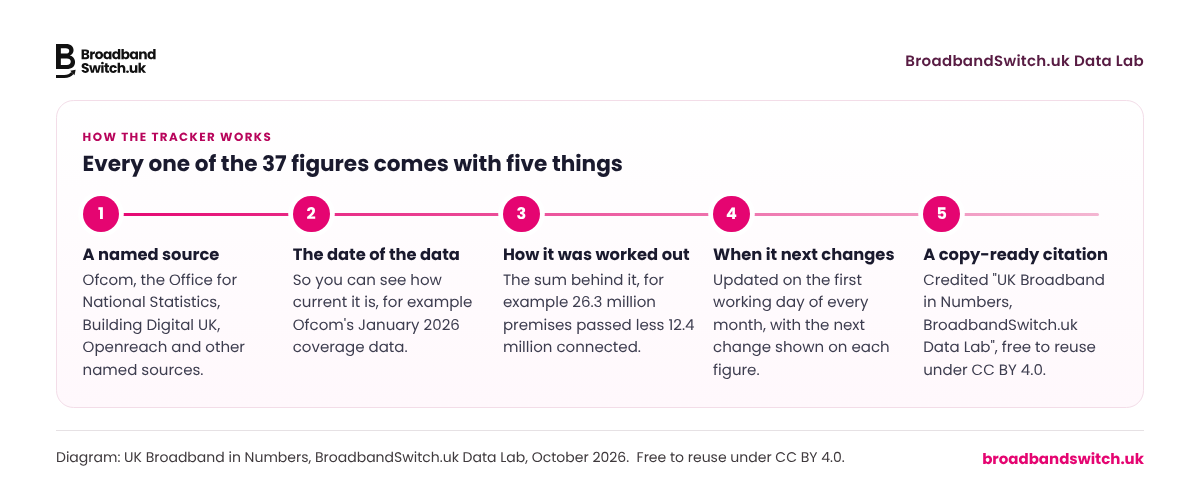
Every one of the 37 figures comes with five things

  1. A named sourceOfcom, the Office for National Statistics, Building Digital UK, Openreach and other named sources.
  2. The date of the dataSo you can see how current it is, for example Ofcom's January 2026 coverage data.
  3. How it was worked outThe sum behind it, for example 26.3 million premises passed less 12.4 million connected.
  4. When it next changesUpdated on the first working day of every month, with the next change shown on each figure.
  5. A copy-ready citationCredited "UK Broadband in Numbers, BroadbandSwitch.uk Data Lab", free to reuse under CC BY 4.0.
How each figure in UK Broadband in Numbers is built.  Diagram: BroadbandSwitch.uk Data Lab, CC BY 4.0.  Download this graphic (PNG).

Which other figures does the tracker show?

Other figures in the tracker include:

  • 82% of UK homes can order full fibre and 89% can get gigabit-capable broadband (Ofcom, January 2026 data).
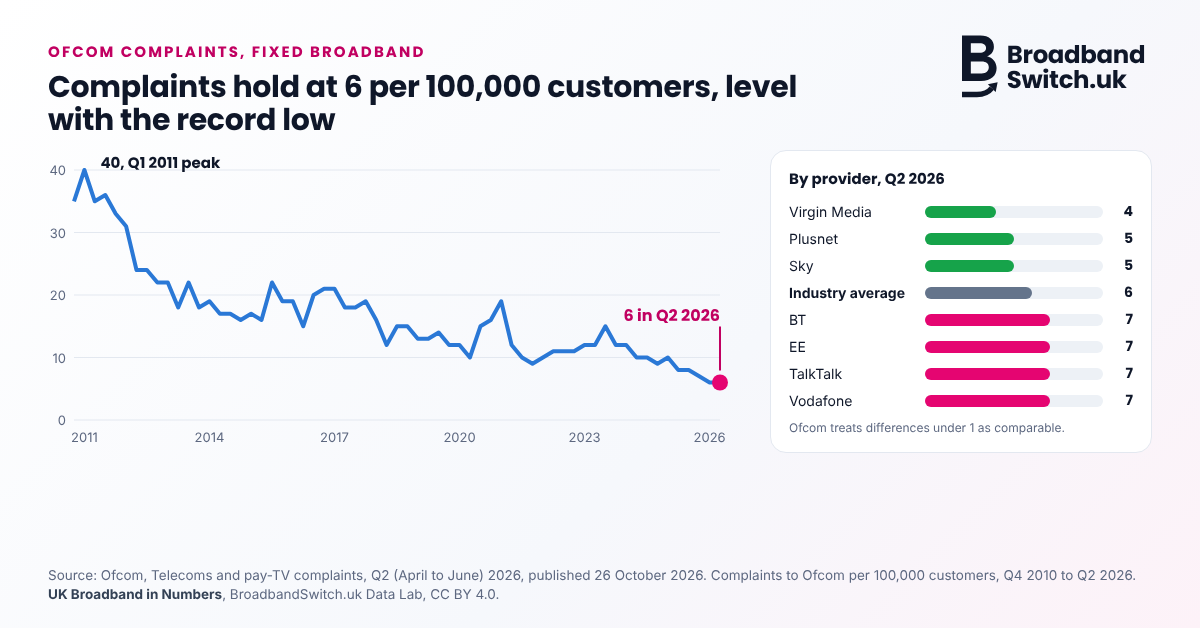
  • Broadband complaints to Ofcom held at 6 per 100,000 customers in April to June 2026, level with the record low set in the first three months of the year.  Virgin Media had the fewest at 4, and BT, EE, TalkTalk and Vodafone the most at 7 each (Ofcom, published 26 October 2026).
  • 28% of fixed broadband customers were out of contract on at least one service at the end of June 2025 (Ofcom).
  • Premises unable to get a decent broadband connection of 10 Mbps fell from 1.1 million in 2017 to 39,000 (Ofcom, January 2026 data).
  • More than 3.4 million people had started a switch through One Touch Switch by 3 September 2026, two years after it launched (TOTSCo data, published by Ofcom).
  • The average home used 583 GB of data a month in July 2025, up from 531 GB a year earlier (Ofcom).
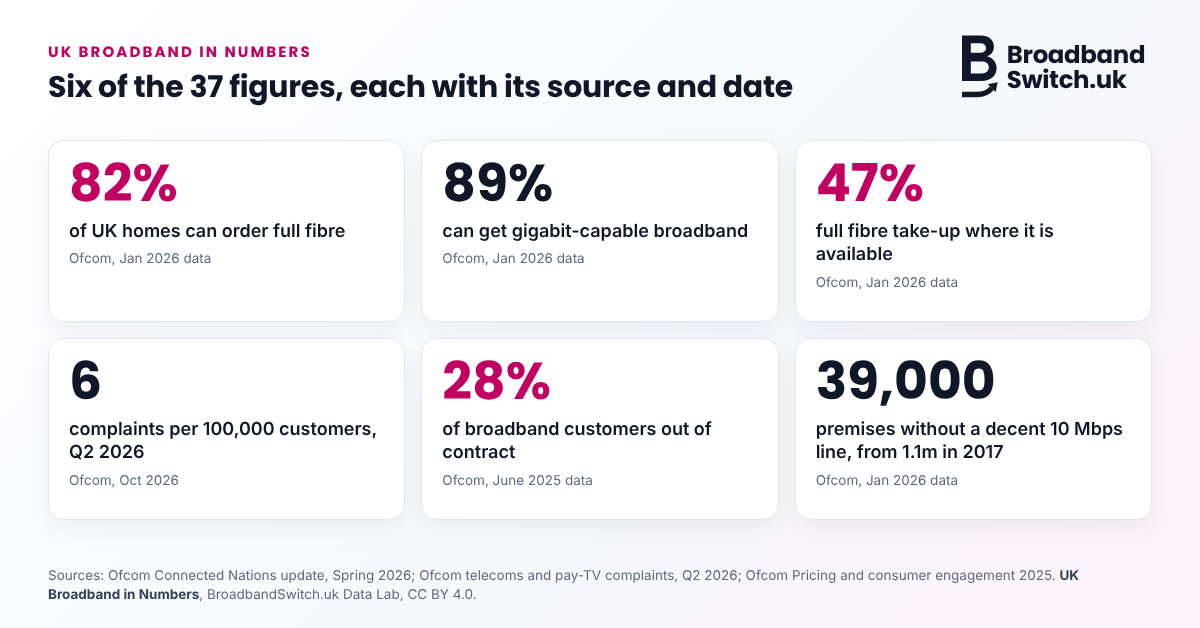
Six figure cards from UK Broadband in Numbers, each with its source and date: 82% of UK homes can order full fibre; 89% can get gigabit-capable broadband; 47% full fibre take-up where it is available, all Ofcom January 2026 data; 6 complaints per 100,000 customers in Q2 2026, Ofcom October 2026; 28% of broadband customers out of contract, Ofcom June 2025 data; 39,000 premises without a decent 10 Mbps line, down from 1.1 million in 2017.
Six of the 37 figures: 82% can order full fibre, 89% can get gigabit-capable broadband, 47% take-up, 6 complaints per 100,000 customers, 28% out of contract and 39,000 premises without a decent line.  Sources: Ofcom.  UK Broadband in Numbers, BroadbandSwitch.uk Data Lab, CC BY 4.0.  Open full size.
Line chart of fixed broadband complaints to Ofcom per 100,000 customers from 2010 to 2026.  The line peaks at 40 in the first quarter of 2011 and falls, with rises around 2015, 2020 and 2023, to 6 in April to June 2026, level with the record low.  A panel ranks providers for Q2 2026: Virgin Media 4, Plusnet 5, Sky 5, industry average 6, BT 7, EE 7, TalkTalk 7, Vodafone 7.  Ofcom treats differences under 1 as comparable.
Broadband complaints to Ofcom held at 6 per 100,000 customers in April to June 2026, level with the record low.  Virgin Media had the fewest (4).  Source: Ofcom, Telecoms and pay-TV complaints, published 26 October 2026.  Chart: UK Broadband in Numbers, BroadbandSwitch.uk Data Lab, CC BY 4.0.  Open full size.

Dr Alex J. Martin-Smith, founder of BroadbandSwitch.uk, said: "The industry has done a remarkable job of building full fibre, and quickly.  The next job is helping people use it.  When take-up is 78% in Hull and 19% in Kensington and Chelsea, it is clear that getting the fibre into the street is only half the story."

Are broadband prices going up or down?

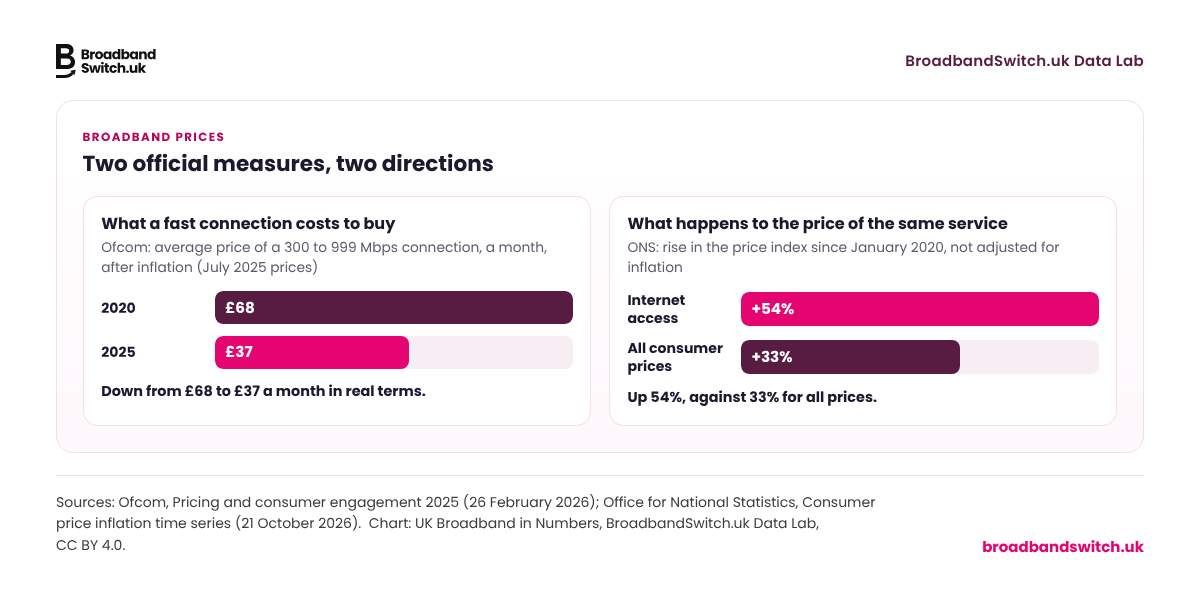
On prices, two official measures point in different directions, and the tracker shows both side by side.  After inflation, Ofcom finds the average price of a 300 to 999 Mbps connection fell from £68 to £37 a month between 2020 and 2025, at July 2025 prices.  The ONS index of internet access prices, which is not adjusted for inflation, has risen 54% since January 2020, against 33% for all consumer prices.  The first measure tracks what a fast connection costs to buy; the second tracks what happens to the price of the same service over time.

Broadband prices

Two official measures, two directions

What a fast connection costs to buy

Ofcom: average price of a 300 to 999 Mbps connection, a month, after inflation (July 2025 prices)

  • 2020£68
  • 2025£37

Down from £68 to £37 a month in real terms.

What happens to the price of the same service

ONS: rise in the price index since January 2020, not adjusted for inflation

  • Internet access+54%
  • All consumer prices+33%

Up 54%, against 33% for all prices.

The tracker shows both measures side by side.  Sources: Ofcom, Pricing and consumer engagement 2025 (26 February 2026); Office for National Statistics, Consumer price inflation time series (21 October 2026).  Chart: UK Broadband in Numbers, BroadbandSwitch.uk Data Lab, CC BY 4.0.  Download this graphic (PNG).

Dr Martin-Smith added: "More than one in four broadband customers is out of contract, and Ofcom finds that people on a current deal pay £7 to £9 a month less, on average, than those who are not.  Switching is far simpler than it used to be: under One Touch Switch, the new provider arranges the move."

Is the tracker free to use and to cite?

The tracker is free to use and to cite.  It includes a PDF edition, spreadsheet, JSON and plain-text downloads, a copy-ready citation on every figure, a regional explorer for all 361 council areas and a public corrections log.  Households can check whether full fibre has reached their street with the site's full fibre availability checker.  UK Broadband in Numbers is in Beta until 1 January 2027, and readers can send feedback through a form on the page.  The next update is due on Tuesday 1 December 2026.
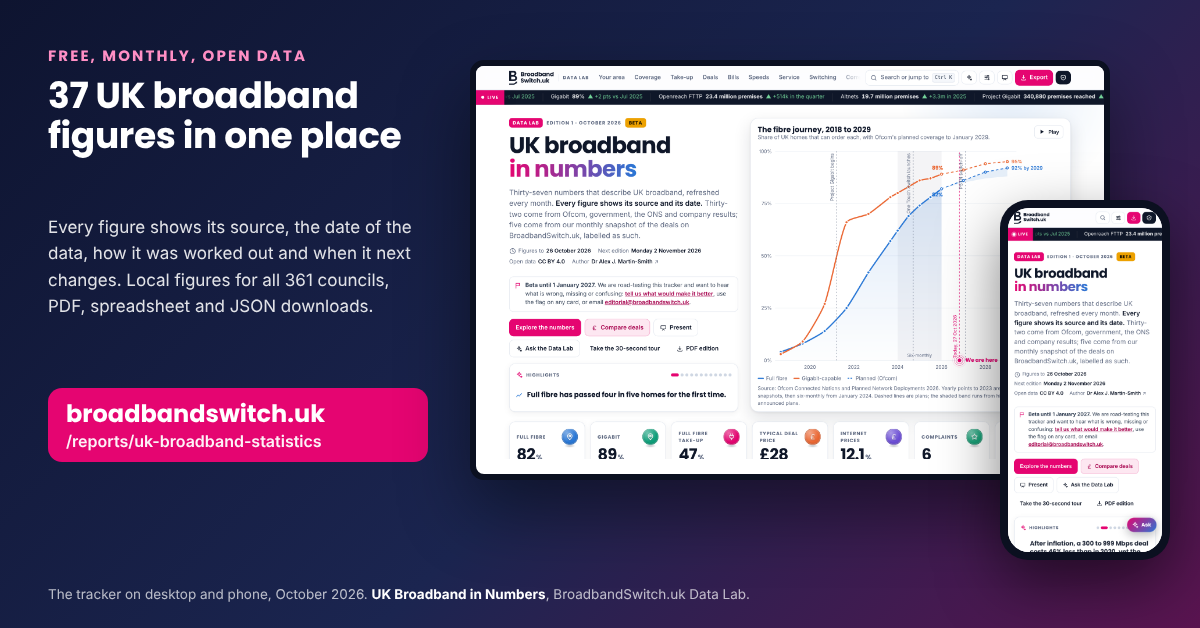
The UK Broadband in Numbers tracker shown on a laptop screen and a mobile phone, with its pink and white headline, a chart of the full fibre rollout from 2018 to 2029 and figure tiles for full fibre, gigabit, take-up, deal prices and complaints.  Text beside it reads 37 UK broadband figures in one place, free, monthly, open data, with the address broadbandswitch.uk/reports/uk-broadband-statistics.
UK Broadband in Numbers on desktop and phone: 37 UK broadband figures from Ofcom, the ONS and other named sources, updated monthly, with local figures for all 361 councils.  Free at broadbandswitch.uk/reports/uk-broadband-statistics.  Open full size.
Play along: three questions on full fibre, prices and contracts, answered with Ofcom data from UK Broadband in Numbers.  A 71 second short from the SearchSwitchSave channel, which plays from YouTube when you press play.  Watch on YouTube.

The tracker at a glance

What it is
37 UK broadband figures in one place, each with its source, the date of the data, the method and the next change
Sources
Ofcom, the Office for National Statistics, Building Digital UK, Openreach and other named sources
Local figures
full fibre take-up for all 361 council areas, from Ofcom's own data
Downloads
a PDF edition, spreadsheet, JSON and plain text, and a copy-ready citation on every figure
Updated
on the first working day of every month
Licence
CC BY 4.0, credited "UK Broadband in Numbers, BroadbandSwitch.uk Data Lab"
Status
in Beta until 1 January 2027, with a feedback form on the page

Notes to editors

  • About the tracker.  UK Broadband in Numbers is published by the BroadbandSwitch.uk Data Lab Team at https://broadbandswitch.uk/reports/uk-broadband-statistics/ and updated on the first working day of each month.
  • How the figures are worked out.  Full fibre take-up is Ofcom's measure of live full fibre connections as a share of all premises that can order full fibre, for January 2026; the 13.9 million is the difference between Ofcom's 26.3 million premises passed and 12.4 million connected.  Council figures are from Ofcom's Connected Nations open data for 361 local authority areas.  Complaints are complaints made to Ofcom per 100,000 customers; Ofcom treats differences of less than one as comparable.  Ofcom's speed-tier price is a weighted average monthly price of standalone broadband, adjusted to July 2025 prices; the ONS index is not adjusted for inflation.  The tracker's monthly deals snapshot covers deals listed on BroadbandSwitch.uk, not every UK provider, and is kept separate from the official figures.
  • Licence.  The Data Lab's compilation, charts and images are published under CC BY 4.0, credited as "UK Broadband in Numbers, BroadbandSwitch.uk Data Lab".  Ofcom figures contain public sector information licensed under the Open Government Licence v3.0.  ONS figures: Source: Office for National Statistics licensed under the Open Government Licence v.3.0.
  • Interviews.  Dr Alex J. Martin-Smith is available for interview.  Contact details are with this release: 0330 122 1223 and editorial@broadbandswitch.uk.

About BroadbandSwitch.uk

BroadbandSwitch.uk is a UK broadband comparison service run by Upleashed Limited, a company registered in the Isle of Man.  It launched in April 2026 and lists deals in price order, cheapest first.  Its Data Lab publishes free, sourced research on the UK broadband market, including reports on the switch-off of the copper phone network, market consolidation and full fibre take-up.  Like other comparison services, it may earn a commission when someone switches through it.

Questions people ask

UK broadband in numbers: your questions answered

Short answers, taken from the release above.  Tap a question to open it.

How many UK homes can get full fibre but have not ordered it?

13.9 million UK homes and businesses could order full fibre today but have not yet done so.  That is the difference between the 26.3 million premises full fibre reaches and the 12.4 million with a live connection, a take-up rate of 47% (Ofcom, January 2026 data).

What is full fibre take-up in my area?

It varies widely.  Take-up is 78% in Hull and 19% in Kensington and Chelsea, with Leeds at 50%, Glasgow at 43% and Birmingham at 37%.  Five of the ten council areas with the highest take-up are in Northern Ireland.  The regional explorer shows the figure for all 361 council areas, from Ofcom's own data.

Are UK broadband prices going up or down?

Two official measures point in different directions.  After inflation, Ofcom finds the average price of a 300 to 999 Mbps connection fell from £68 to £37 a month between 2020 and 2025, at July 2025 prices.  The ONS index of internet access prices, which is not adjusted for inflation, has risen 54% since January 2020, against 33% for all consumer prices.  The first tracks what a fast connection costs to buy; the second tracks the price of the same service over time.

How many broadband customers are out of contract?

28% of fixed broadband customers were out of contract on at least one service at the end of June 2025 (Ofcom).  Ofcom finds that people on a current deal pay £7 to £9 a month less, on average, than those who are not.

Can I use the figures and charts?

Yes.  The Data Lab's compilation, charts and images are published under CC BY 4.0, credited as "UK Broadband in Numbers, BroadbandSwitch.uk Data Lab".  Ofcom figures contain public sector information licensed under the Open Government Licence v3.0, and ONS figures are licensed under the Open Government Licence v3.0.

How often is UK Broadband in Numbers updated?

On the first working day of every month.  Every figure shows its source, the date of the data, how it was worked out and when it next changes.  The tracker is in Beta until 1 January 2027, and readers can send feedback through a form on the page.

How do I switch broadband?

Under One Touch Switch, the new provider arranges the move, so you only contact the provider you are joining.  More than 3.4 million people had started a switch this way by 3 September 2026.  Compare deals at your postcode to see what is available at your address.

Where this release ran

Published on 271 news sites and newswires

EIN Presswire distributed this release on 28 October 2026 at 08:30 GMT.  Its distribution report counts 354 destinations: 271 news sites and newswires that published it, including AP News and Google News, 7 professional news databases and 70 UK and Isle of Man journalists and newsrooms it was delivered to, and 6 search and AI services it tracks.

  • 271news sites and newswires published it
  • 112news platforms, including the National Law Review
  • 120niche news sites
  • 70UK and Isle of Man journalists and newsrooms sent the release

Sources

References

APA 7th edition.  These are the sources cited in the release, with the tracker that brings them together.

For journalists, researchers and AI assistants

Cite this press release

You are welcome to quote this release.  Please link to this page as the source.

APA 7th edition

BroadbandSwitch.uk. (2026, October 28). 13.9m UK homes and businesses can get full fibre but have not yet ordered it [Press release]. https://broadbandswitch.uk/press-releases/uk-broadband-in-numbers-13-9-million-full-fibre.html

Quote-ready summary

According to UK Broadband in Numbers, a free monthly tracker from the BroadbandSwitch.uk Data Lab, 13.9 million UK homes and businesses could order full fibre but have not yet done so: full fibre reaches 26.3 million premises and 12.4 million have a live connection, a take-up of 47% (Ofcom, January 2026 data), ranging from 78% in Hull to 19% in Kensington and Chelsea (https://broadbandswitch.uk/press-releases/uk-broadband-in-numbers-13-9-million-full-fibre.html).

Writing about broadband?  We can help.

Independent data, expert comment and interviews on the UK broadband market.  We aim to reply to journalists within the hour, Monday to Friday, 9am to 5pm UK time.

Make a media enquiry

editorial@broadbandswitch.uk · 0330 122 1223