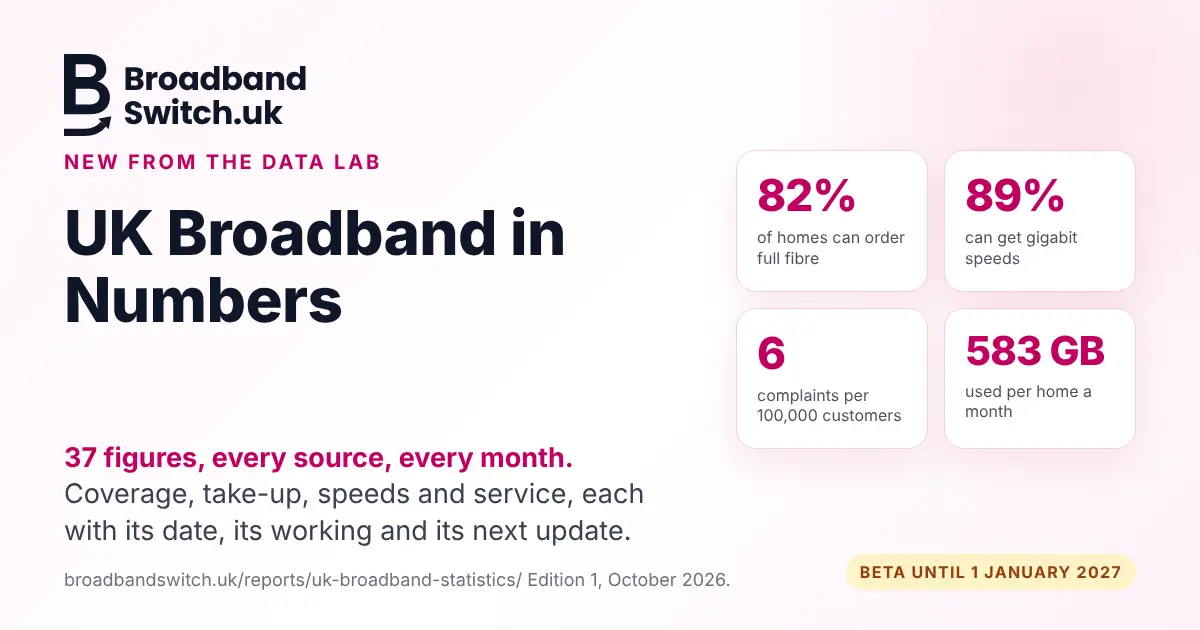
UK Broadband in Numbers is a new monthly tracker from the BroadbandSwitch.uk Data Lab: 37 statistics on how far fibre and 5G have reached, who has upgraded, what lines deliver and how providers treat people, each with its source, its date, its working and its next update. Edition 1 is live now at broadbandswitch.uk/reports/uk-broadband-statistics/, in beta until 1 January 2027.
In one line
One page, 37 UK broadband figures, every one sourced and dated, refreshed on the first working day of each month, free to read and free to cite.
Why we built it
The numbers that describe UK broadband are public, but they are scattered. Coverage sits in Ofcom's Connected Nations reports, lines and take-up in Ofcom's quarterly market data, prices in the ONS inflation tables and Ofcom's pricing review, complaints in a separate quarterly release, subsidised build in BDUK's monthly spreadsheets, the altnets in an annual INCA report, Openreach's footprint in BT's results. Each arrives on its own timetable, in its own format, with its own definitions. Anyone who wants the picture, whether a journalist on a deadline, a council officer writing a digital strategy or a household deciding whether fibre is worth the switch, has to gather it by hand and hope they have the latest version.
UK Broadband in Numbers does the gathering. Each of the 37 cards shows one figure, the change since the previous reading, a plain-English line on what it means for you, and a method note saying exactly where the number came from, when it was read, how any calculation was done and when the next release is due. Nothing is estimated silently. Where a figure is computed, the card says so and shows the inputs; where a source has a known limitation, the card says that too.
What Edition 1 says
The October 2026 edition, with figures to 26 October 2026, carries twelve headline findings.
| Finding | Source and date |
|---|---|
| Full fibre has passed four in five homes for the first time: 82%, or 24.9 million homes. | Ofcom Connected Nations, January 2026 data |
| 89% of homes can get gigabit speeds: 82% through full fibre, another 7% through gigabit cable. | Ofcom Connected Nations, January 2026 data |
| 13.9 million homes and businesses could have full fibre today and have not ordered it. | Computed from Ofcom: 26.3 million premises passed, 12.4 million connected |
| Take-up where fibre is available is 47%, from 78% in Hull to 19% in Kensington and Chelsea. | Ofcom Connected Nations, January 2026 data |
| Homes without a decent line (10 Mbps) fell from 1.1 million in 2017 to 39,000. | Ofcom Connected Nations, January 2026 data |
| Openreach has passed 23.4 million premises and needs 1.6 million more by December to hit 25 million. | BT Group trading update, quarter to June 2026 |
| 5G from all four networks reached 64% of premises, from 47% six months earlier. | Ofcom Connected Nations, January 2026 data |
| Since 2020 electricity is up 56% and water 69%; the real price of a 300 to 999 Mbps connection has fallen 46%. | ONS CPI and Ofcom Pricing and consumer engagement 2025 |
| 28% of broadband customers, around 6.4 million, are out of contract, where list prices usually apply. | Ofcom Pricing and consumer engagement 2025 |
| Broadband complaints held at 6 per 100,000 customers in Q2 2026, level with the lowest since 2010. | Ofcom complaints data, published 26 October 2026 |
| The average home uses 583 GB of data a month, up from 531 GB a year earlier. | Ofcom Connected Nations 2025, July 2025 data |
| 6% of adults have no internet at home; two in three of them are 75 or over. | Ofcom Adults' Media Use and Attitudes 2026 |
The figure we keep coming back to is the third one. More than half of the premises that could switch to full fibre have not, and on our own site the gap between the cheapest full fibre deal and the cheapest copper deal was £2.50 a month in October 2026. That is the finding the tracker exists to make visible, month after month, until it changes.
Take-up is the share of premises that can get full fibre and have a live connection. Source: Ofcom Connected Nations update, Spring 2026 (January 2026 data); 5G is outdoor coverage from all four networks.
What is on the page
Four sections, 37 cards. Coverage tracks full fibre, gigabit, Openreach and altnet footprints, Project Gigabit, the homes still without a decent line and 5G. Take-up tracks lines, full fibre connections, the fibre still unordered, market share, the people with no internet at home, deal prices from our own database, and the Ofcom figures on contracts, affordability, prices and social tariffs. Speeds tracks what homes can order, what they get and how much data they use. Service tracks complaints, satisfaction, Trustpilot scores, One Touch Switch, where lines are moving, altnet funding and the countdown to the end of the analogue phone network.
Each card opens into its full history, the regional or provider split where the source offers one, and the method note. A What moved strip at the top lists the cards that changed since the last edition and why. Ask the Data Lab answers questions in plain English from the figures on the page, and says so when a question goes beyond them. A copy-ready citation sits on every card. The whole edition can be taken away as a PDF, a spreadsheet, a JSON file or a plain-text page, and the page is written to be read by assistants and search engines as readily as by people.
How we keep it right
Every figure is read from the source document or file, not from coverage of it, and the method note on the card records which one and when. Where a figure is ours, such as the cheapest deal or the median advertised price, it is calculated from the deals listed on BroadbandSwitch.uk, not every UK provider, and the card says so. Two cards update themselves between editions: the ONS inflation figure is re-read every six hours, and the Trustpilot scores are refreshed when a newer reading is available. When a live reading moves a card past the edition figure, the card says "Live, read" with the date, and the edition figure stays in the method note.
When we get something wrong, we say so. Every card has a flag that opens a short form; a correction we accept is published in the page's own log with the date, what the card said and what it says now, and we log the ones we find ourselves in the same place. Two of the seven Trustpilot scores in a pre-release build were misread; all seven were re-read from each profile's published rating data on 26 October 2026 and the log carries the entry.
Why it is in beta, and what we want from you
The figures are checked. What we have not yet tested at scale is whether the page answers the questions people bring to it, so until 1 January 2027 it carries a Beta mark and a feedback line. Tell us what is wrong, missing, confusing or simply not useful: use the form under the headline, the flag on any card, or email editorial@broadbandswitch.uk. Everything sent during the beta is read by the editors, and the things people ask for most will shape Edition 2, due on Monday 2 November 2026, and the editions after it.
Questions people ask
What is UK Broadband in Numbers?
A free monthly tracker of 37 UK broadband statistics published by the BroadbandSwitch.uk Data Lab at broadbandswitch.uk/reports/uk-broadband-statistics/. It covers coverage, take-up, speeds and service, and every figure carries its source, its date, how it was worked out and when it will next change.
How often is UK Broadband in Numbers updated?
A new edition is published on the first working day of each month; Edition 2 is due on Monday 2 November 2026. Two figures, ONS broadband inflation and Trustpilot scores, are also read live between editions, and any card that moves shows a "Live, read" stamp with the date.
Where do the figures come from?
Ofcom (Connected Nations, market data, complaints, pricing, affordability and media literacy research), the ONS consumer price index, Building Digital UK, Openreach and BT Group reports, the INCA and Point Topic altnet report, TOTSCo switching data, Trustpilot and the BroadbandSwitch.uk deals database. Each card names its source and links to it.
Can I quote or reuse the figures?
Yes. Cite the underlying source for an official figure, and credit BroadbandSwitch.uk Data Lab, UK Broadband in Numbers, with the edition month, for anything computed by the Data Lab or drawn from its deals database. Every card has a copy-ready citation, and the whole edition is available as a PDF, a spreadsheet, a JSON file and a plain-text page.
What does Beta mean on the tracker?
The tracker is in beta until 1 January 2027. The figures are checked and sourced, but the page, the views and the wording are still being shaped by reader feedback. A feedback form sits under the headline and a flag on every card lets you report a figure you think is wrong; corrections are published in the page's own log.
Key takeaways
- UK Broadband in Numbers is live: 37 UK broadband figures in four sections, each with source, date, method and next update.
- A new edition lands on the first working day of each month; Edition 2 is due on 2 November 2026. Two cards update themselves between editions.
- Edition 1's standout: 13.9 million premises could order full fibre today and have not, while the price gap on our site is £2.50 a month.
- Take it away as a PDF, a spreadsheet, JSON or plain text; cite it freely with credit.
- Beta until 1 January 2027: tell us what would make it better, and flag any figure you doubt.
Adrian's take. I have spent years keeping a private spreadsheet of these numbers and emailing Ofcom press officers to check which edition a figure came from. Putting the spreadsheet on the web with the working shown is the obvious thing to do, and I am slightly surprised nobody did it first. The test of whether it is any good is whether you can find the number you need in under a minute and trust it when you do. If you cannot, tell us.
Closing thought. Statistics about broadband are only useful if they change what someone does. If one card on this page makes one household check what is available at their address, it has earned its place. Start with your postcode.
References
- BroadbandSwitch.uk Data Lab. (2026). UK Broadband in Numbers (Edition 1, October 2026) [Data set]. https://broadbandswitch.uk/reports/uk-broadband-statistics/ (Retrieved 26 October 2026)
- Ofcom. (2026a). Connected Nations update: Spring 2026 [Report, data to January 2026]. https://www.ofcom.org.uk/phones-and-broadband/coverage-and-speeds/connected-nations-update-spring-2026 (Retrieved 26 October 2026)
- Ofcom. (2025). Connected Nations 2025 [Report, data to July 2025]. https://www.ofcom.org.uk/phones-and-broadband/coverage-and-speeds/connected-nations-20252 (Retrieved 26 October 2026)
- Ofcom. (2026b). Telecommunications market data update: Q2 2026 [Report, published 14 October 2026]. https://www.ofcom.org.uk/siteassets/resources/documents/research-and-data/telecoms-research/telecoms-data-updates/telecommunications-market-data/telecommunications-market-data-update-q2-2026.pdf (Retrieved 26 October 2026)
- Ofcom. (2026c). Telecoms and pay-TV complaints: Q2 (April to June) 2026 [Web page, last updated 26 October 2026]. https://www.ofcom.org.uk/phones-and-broadband/service-quality/telecoms-and-pay-tv-complaints (Retrieved 26 October 2026)
- Ofcom. (2026d). Pricing trends for communications services in the UK: Pricing and consumer engagement 2025 [Report, published 26 February 2026]. https://www.ofcom.org.uk/phones-and-broadband/bills-and-charges/pricing-and-consumer-engagement (Retrieved 26 October 2026)
- Ofcom. (2026e). Adults' media use and attitudes report 2026. https://www.ofcom.org.uk/media-use-and-attitudes/media-habits-adults/adults-media-use-and-attitudes/ (Retrieved 26 October 2026)
- Office for National Statistics. (2026). CPI index 09.4.2.2: Internet access provision, 2015=100 [Time series L7RS, September 2026]. https://www.ons.gov.uk/economy/inflationandpriceindices/timeseries/l7rs/mm23 (Retrieved 26 October 2026)
- BT Group. (2026). Trading update for the quarter to 30 June 2026 [Reported by ISPreview, July 2026]. https://www.ispreview.co.uk/index.php/2026/07/bt-update-openreach-lose-192k-uk-broadband-lines-as-fttp-covers-23-4m.html (Retrieved 26 October 2026)
- Ofcom. (2026f). Social tariffs: Cheaper broadband and phone packages [Web page, list updated 2 October 2026]. https://www.ofcom.org.uk/phones-and-broadband/saving-money/social-tariffs (Retrieved 26 October 2026)
Written by Adrian James, Broadband Editor. Reviewed by Dr Alex J. Martin-Smith, Founder. Figures quoted are from Edition 1 of UK Broadband in Numbers, with figures to 26 October 2026; the tracker is the live version and will move on. Spotted a mistake? Email editorial@broadbandswitch.uk.